This article is only relevant for v0.9.10 and later.
Debugging using fgtrace
Tutorial on how to get started with fgtrace
less than a minute
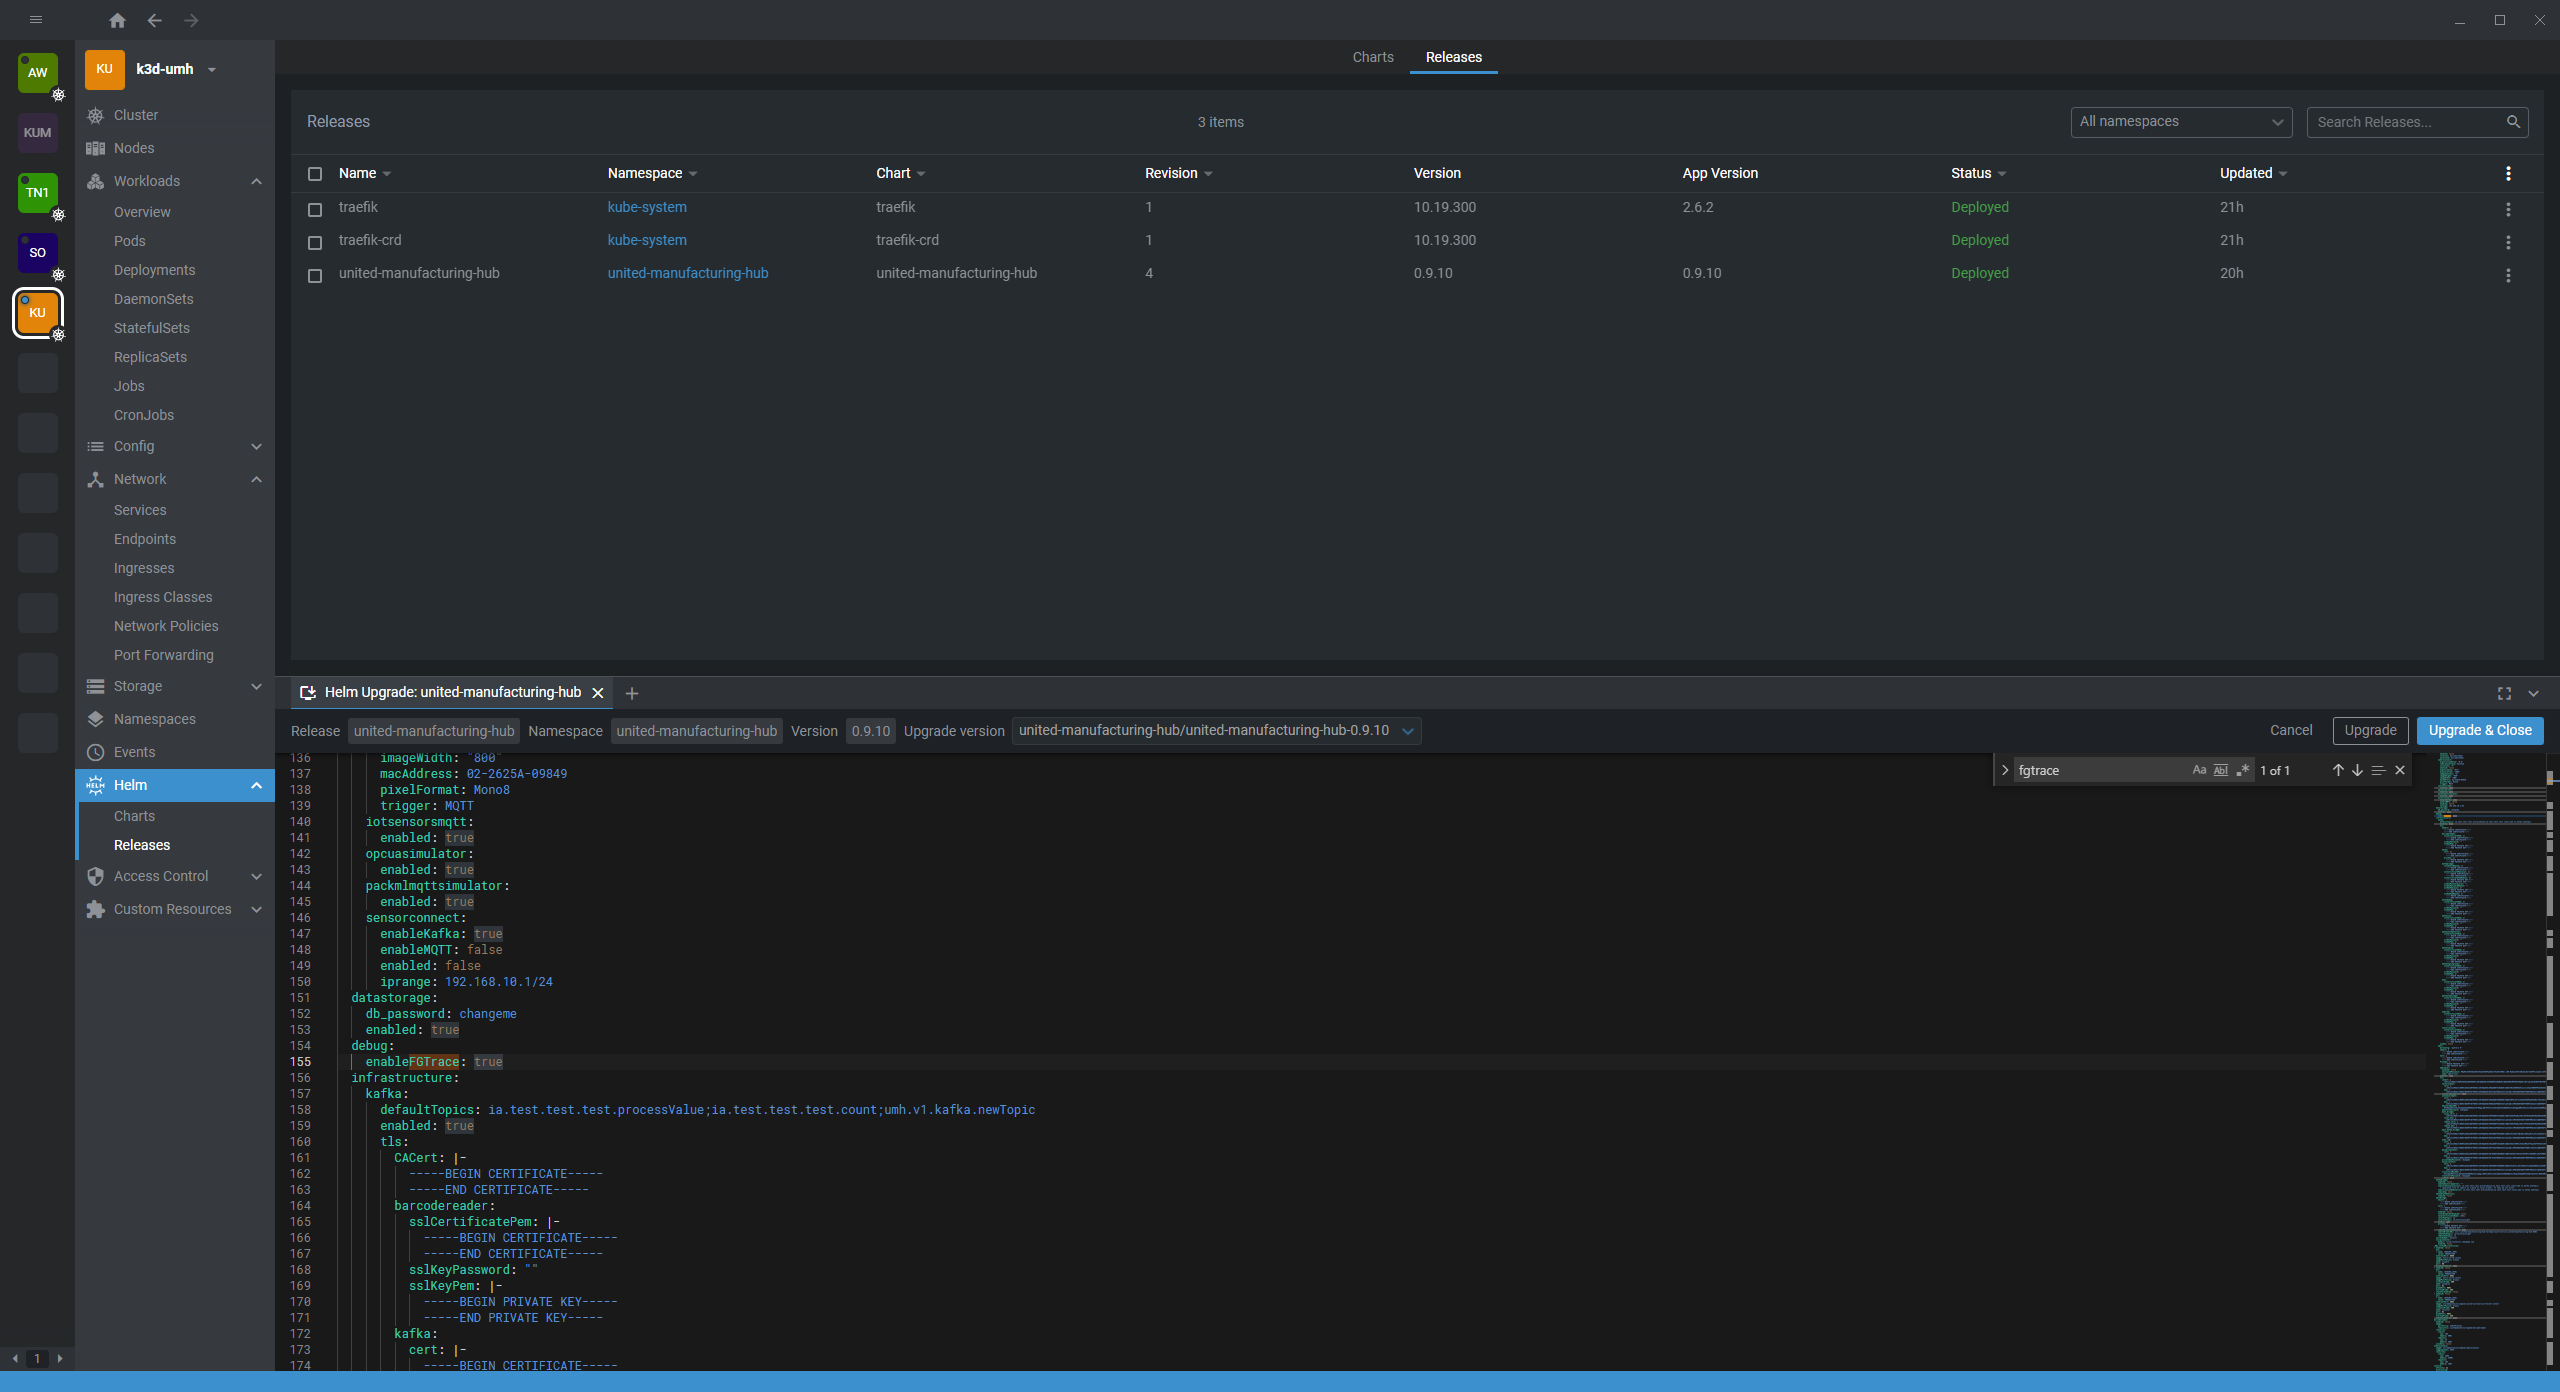
Enable fgtrace
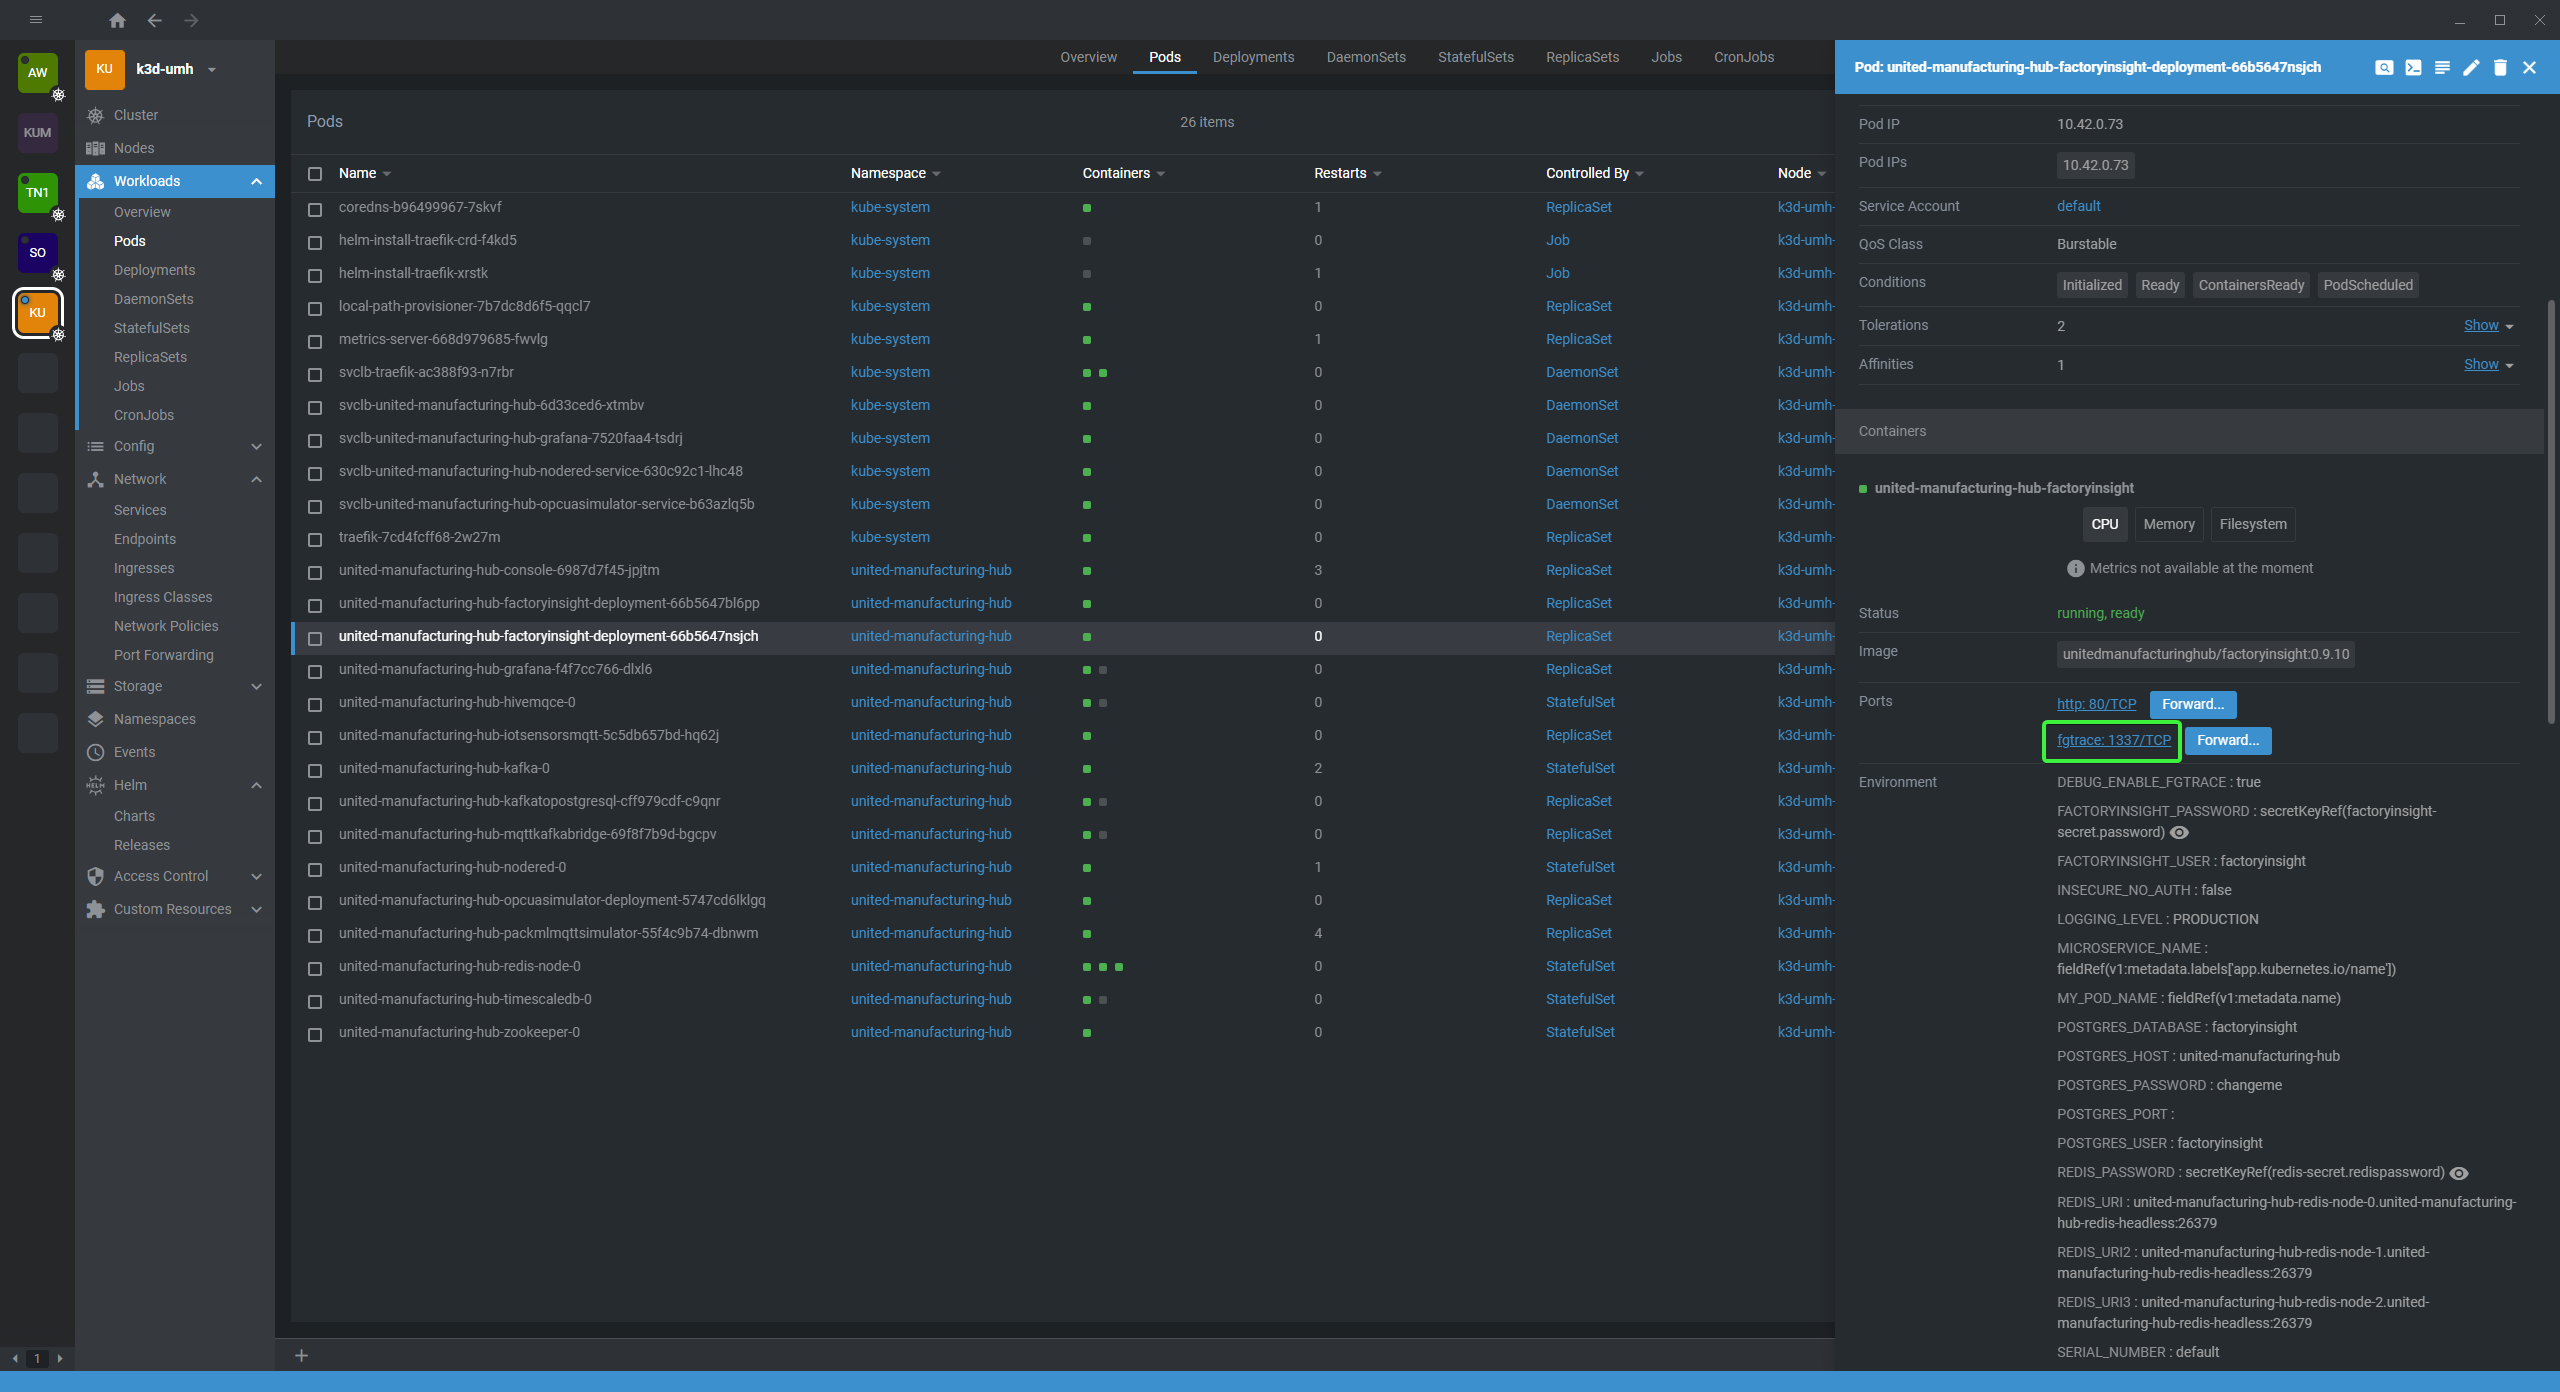
Forward the new fgtrace port
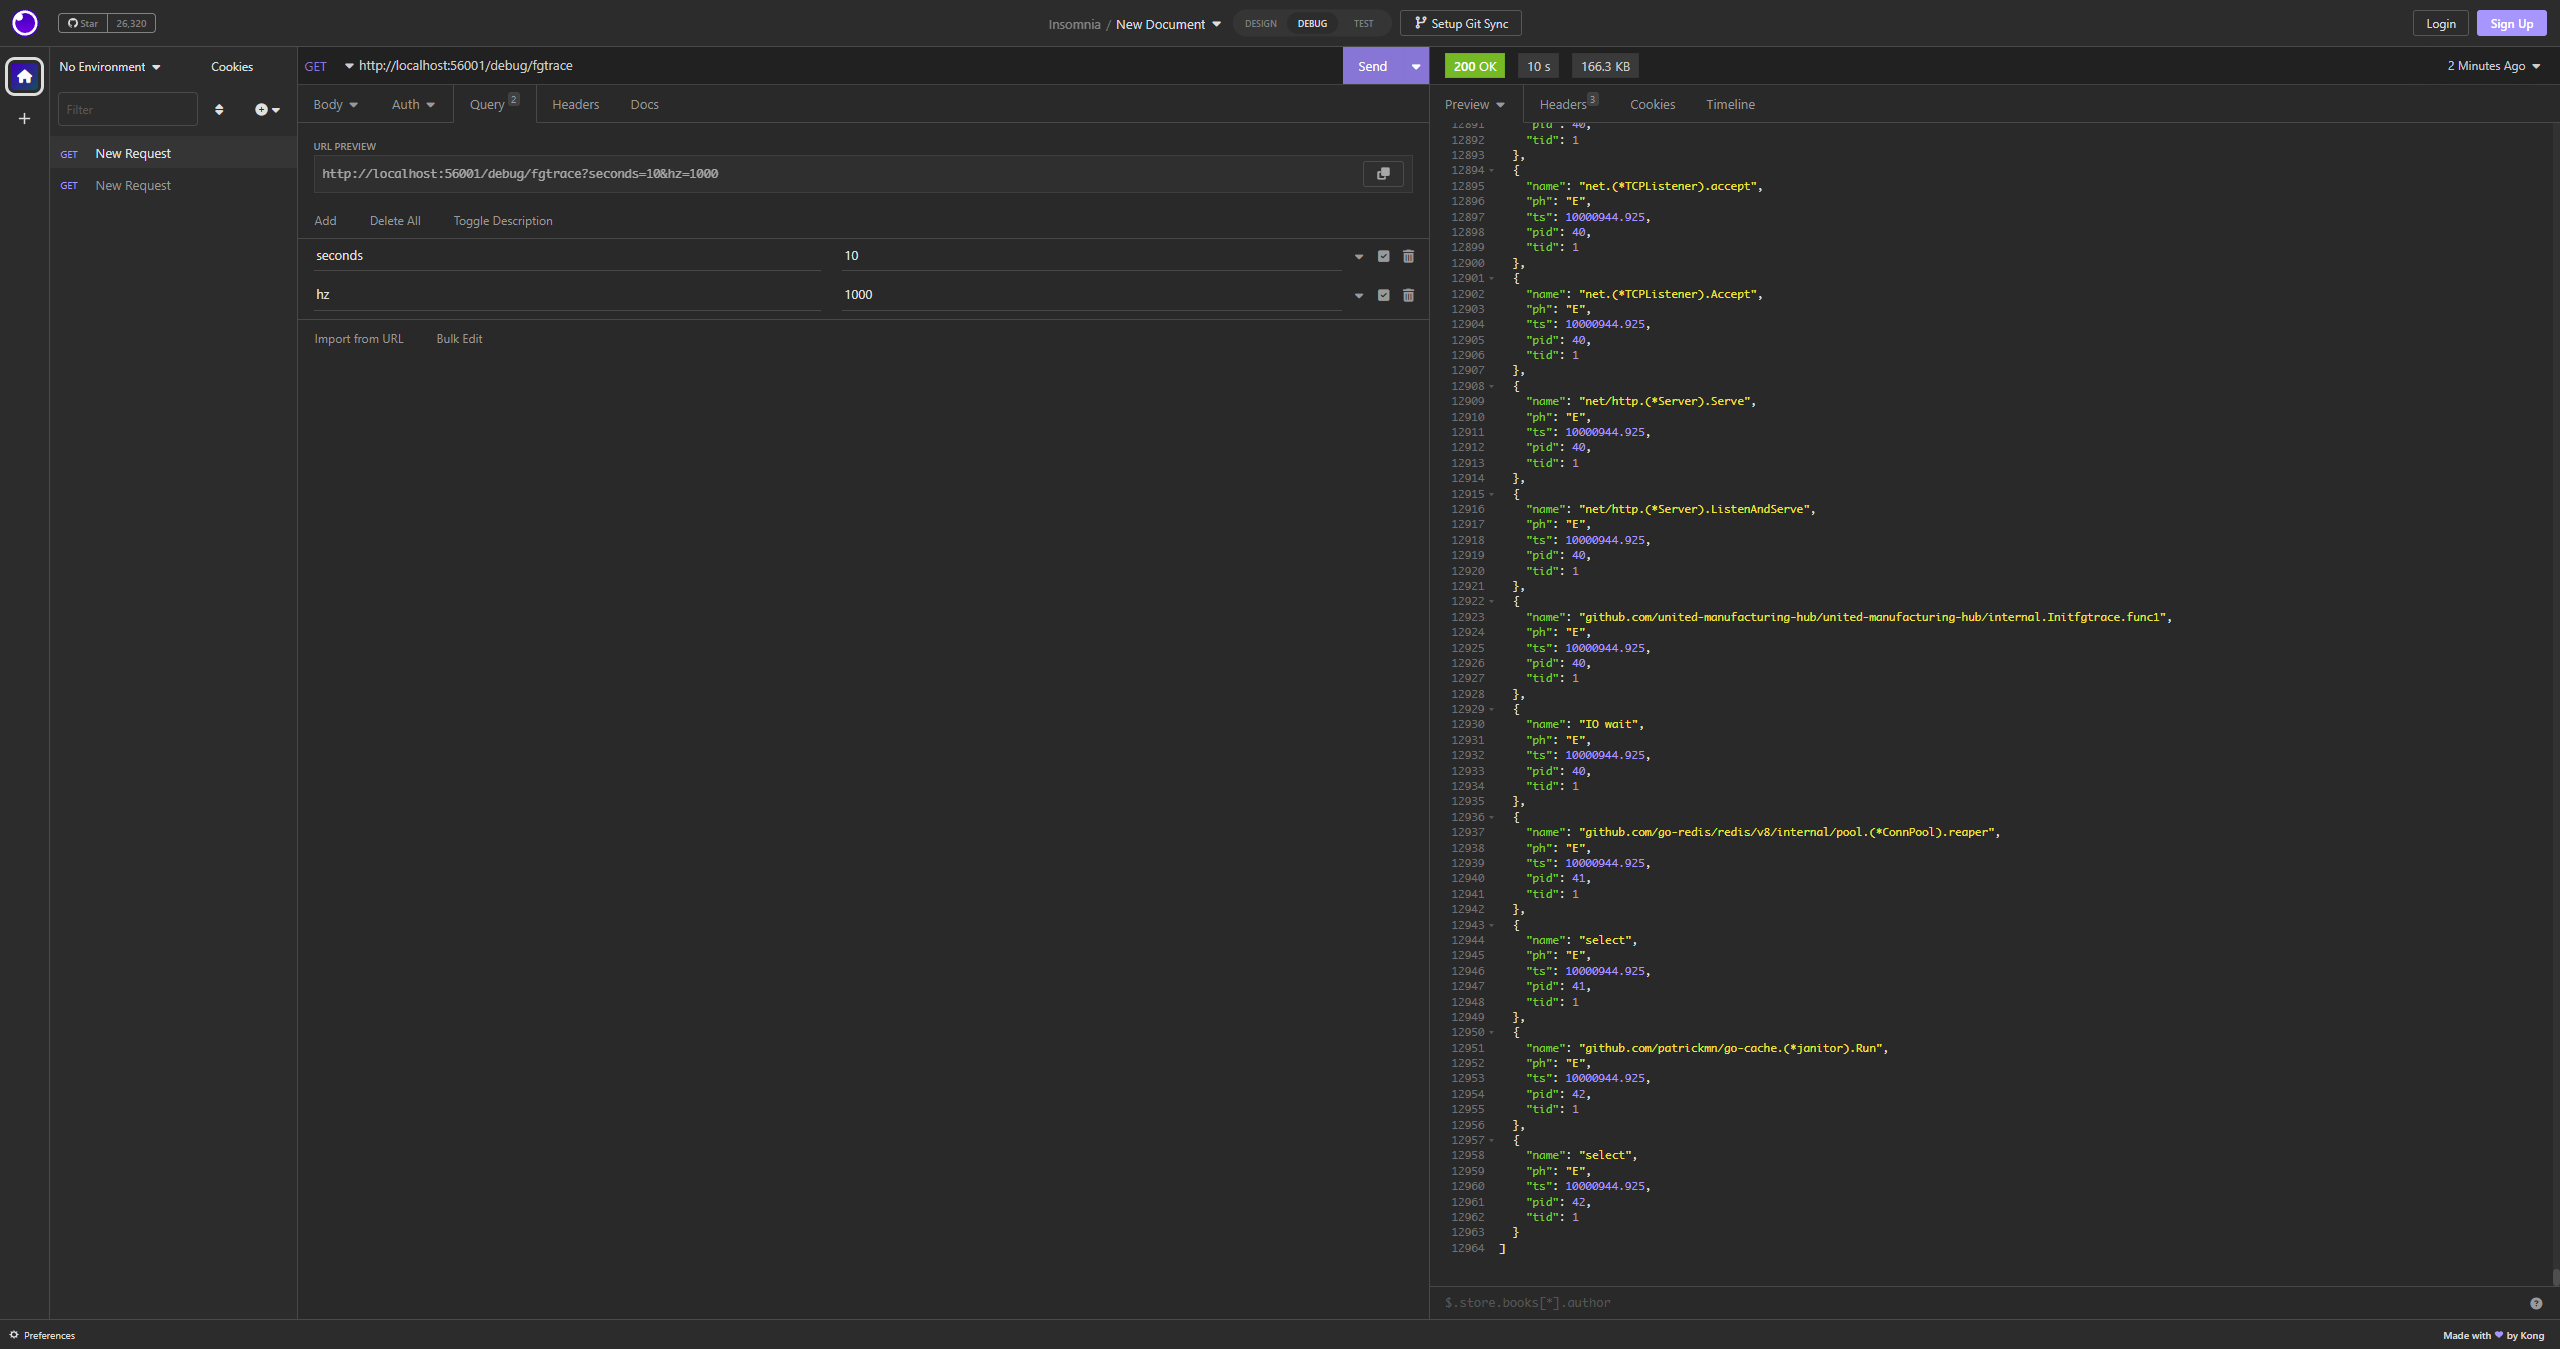
Visit the
/debug/fgtracetrace path using Insomnia or a similar tool. Please note that it will take about half a minute for a trace to complete.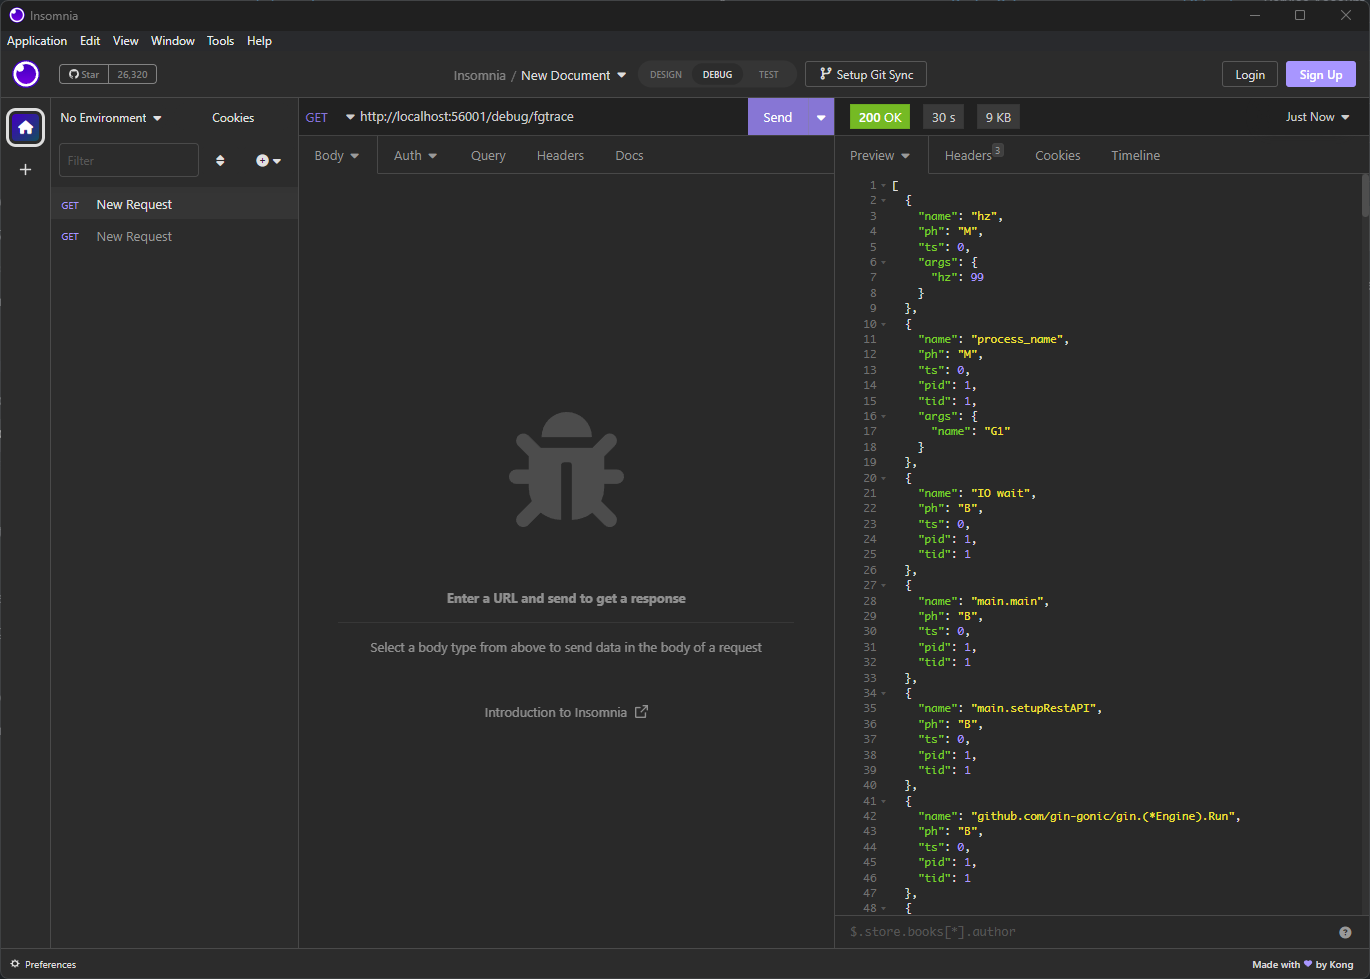
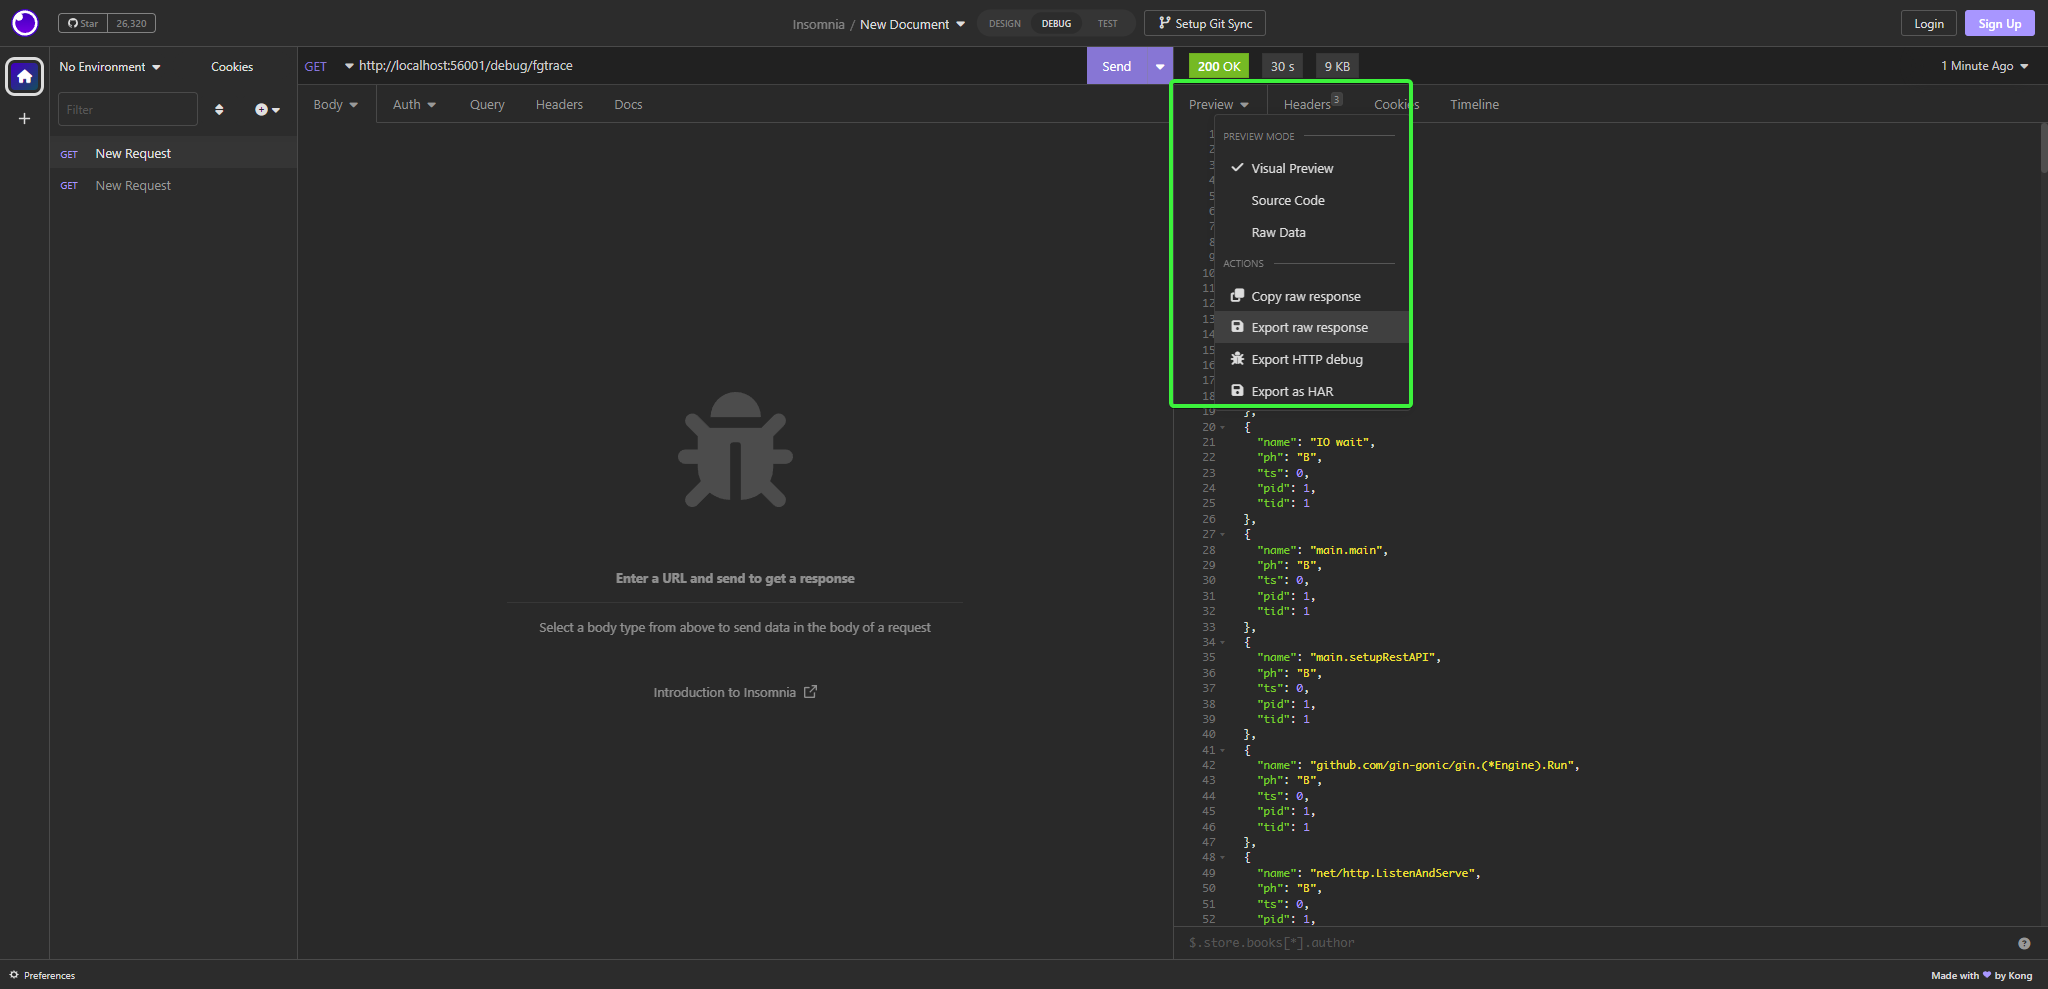
Export the returned JSON
Open the Perfetto UI
Click on “Open trace file” and select the exported JSON
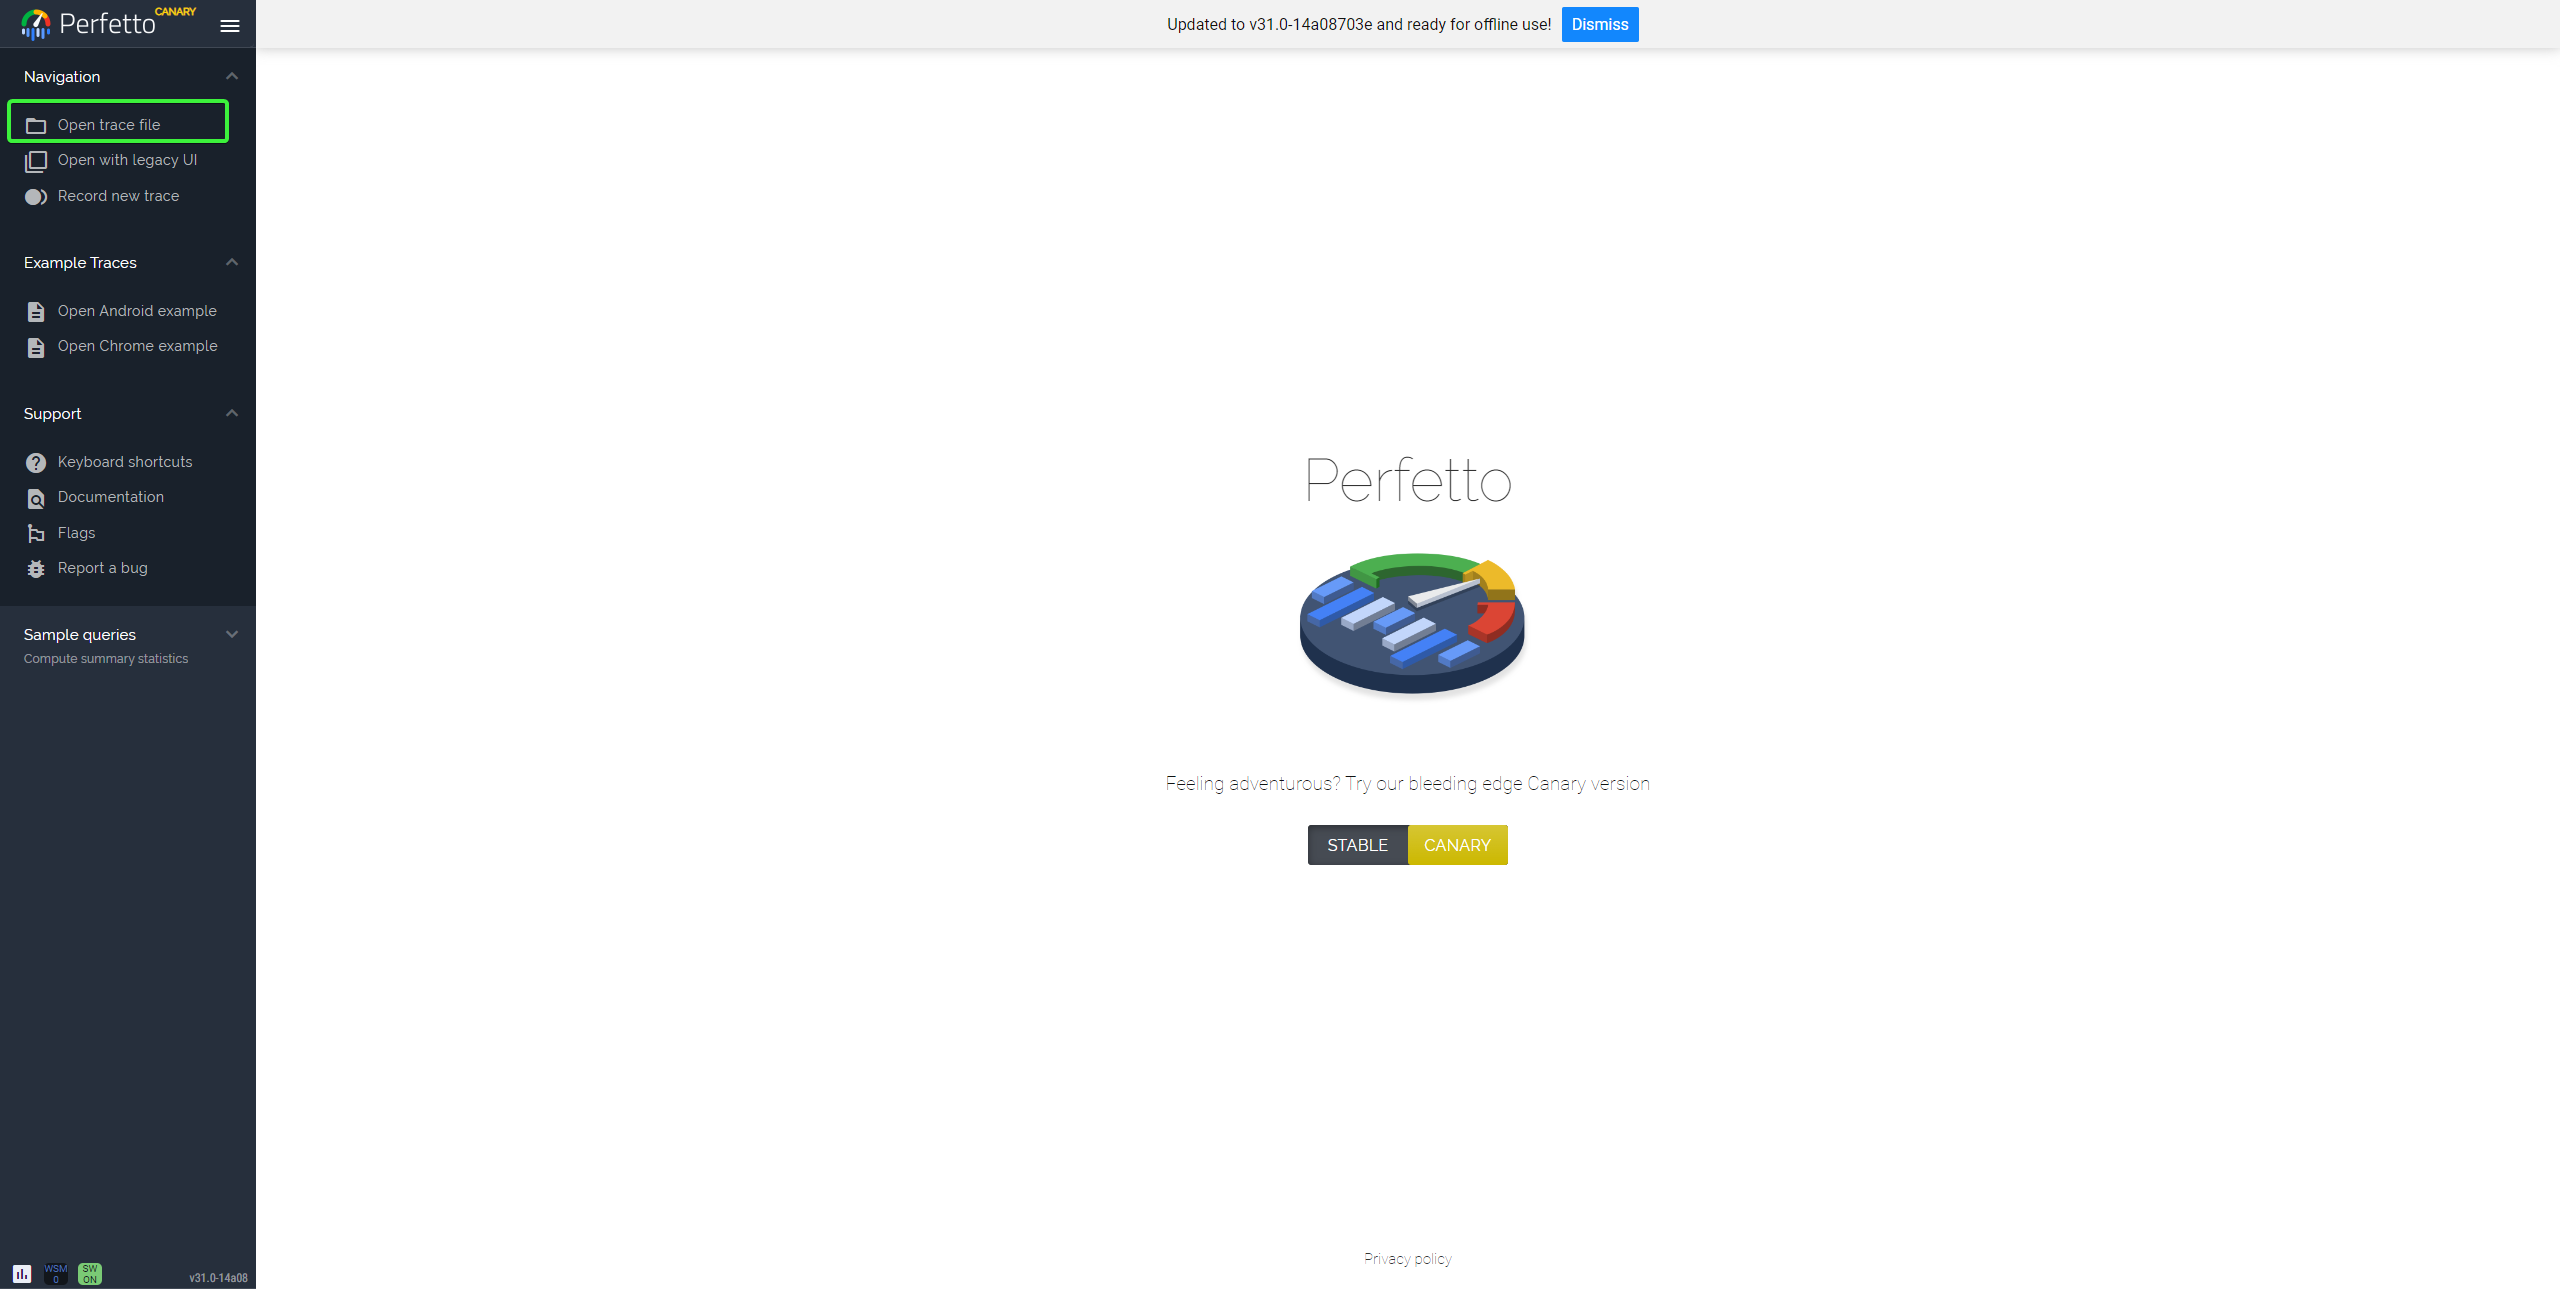
Wait for it to load
You are now viewing a Chrome-like waterfall graph that shows the wallclock time used by each goroutine.
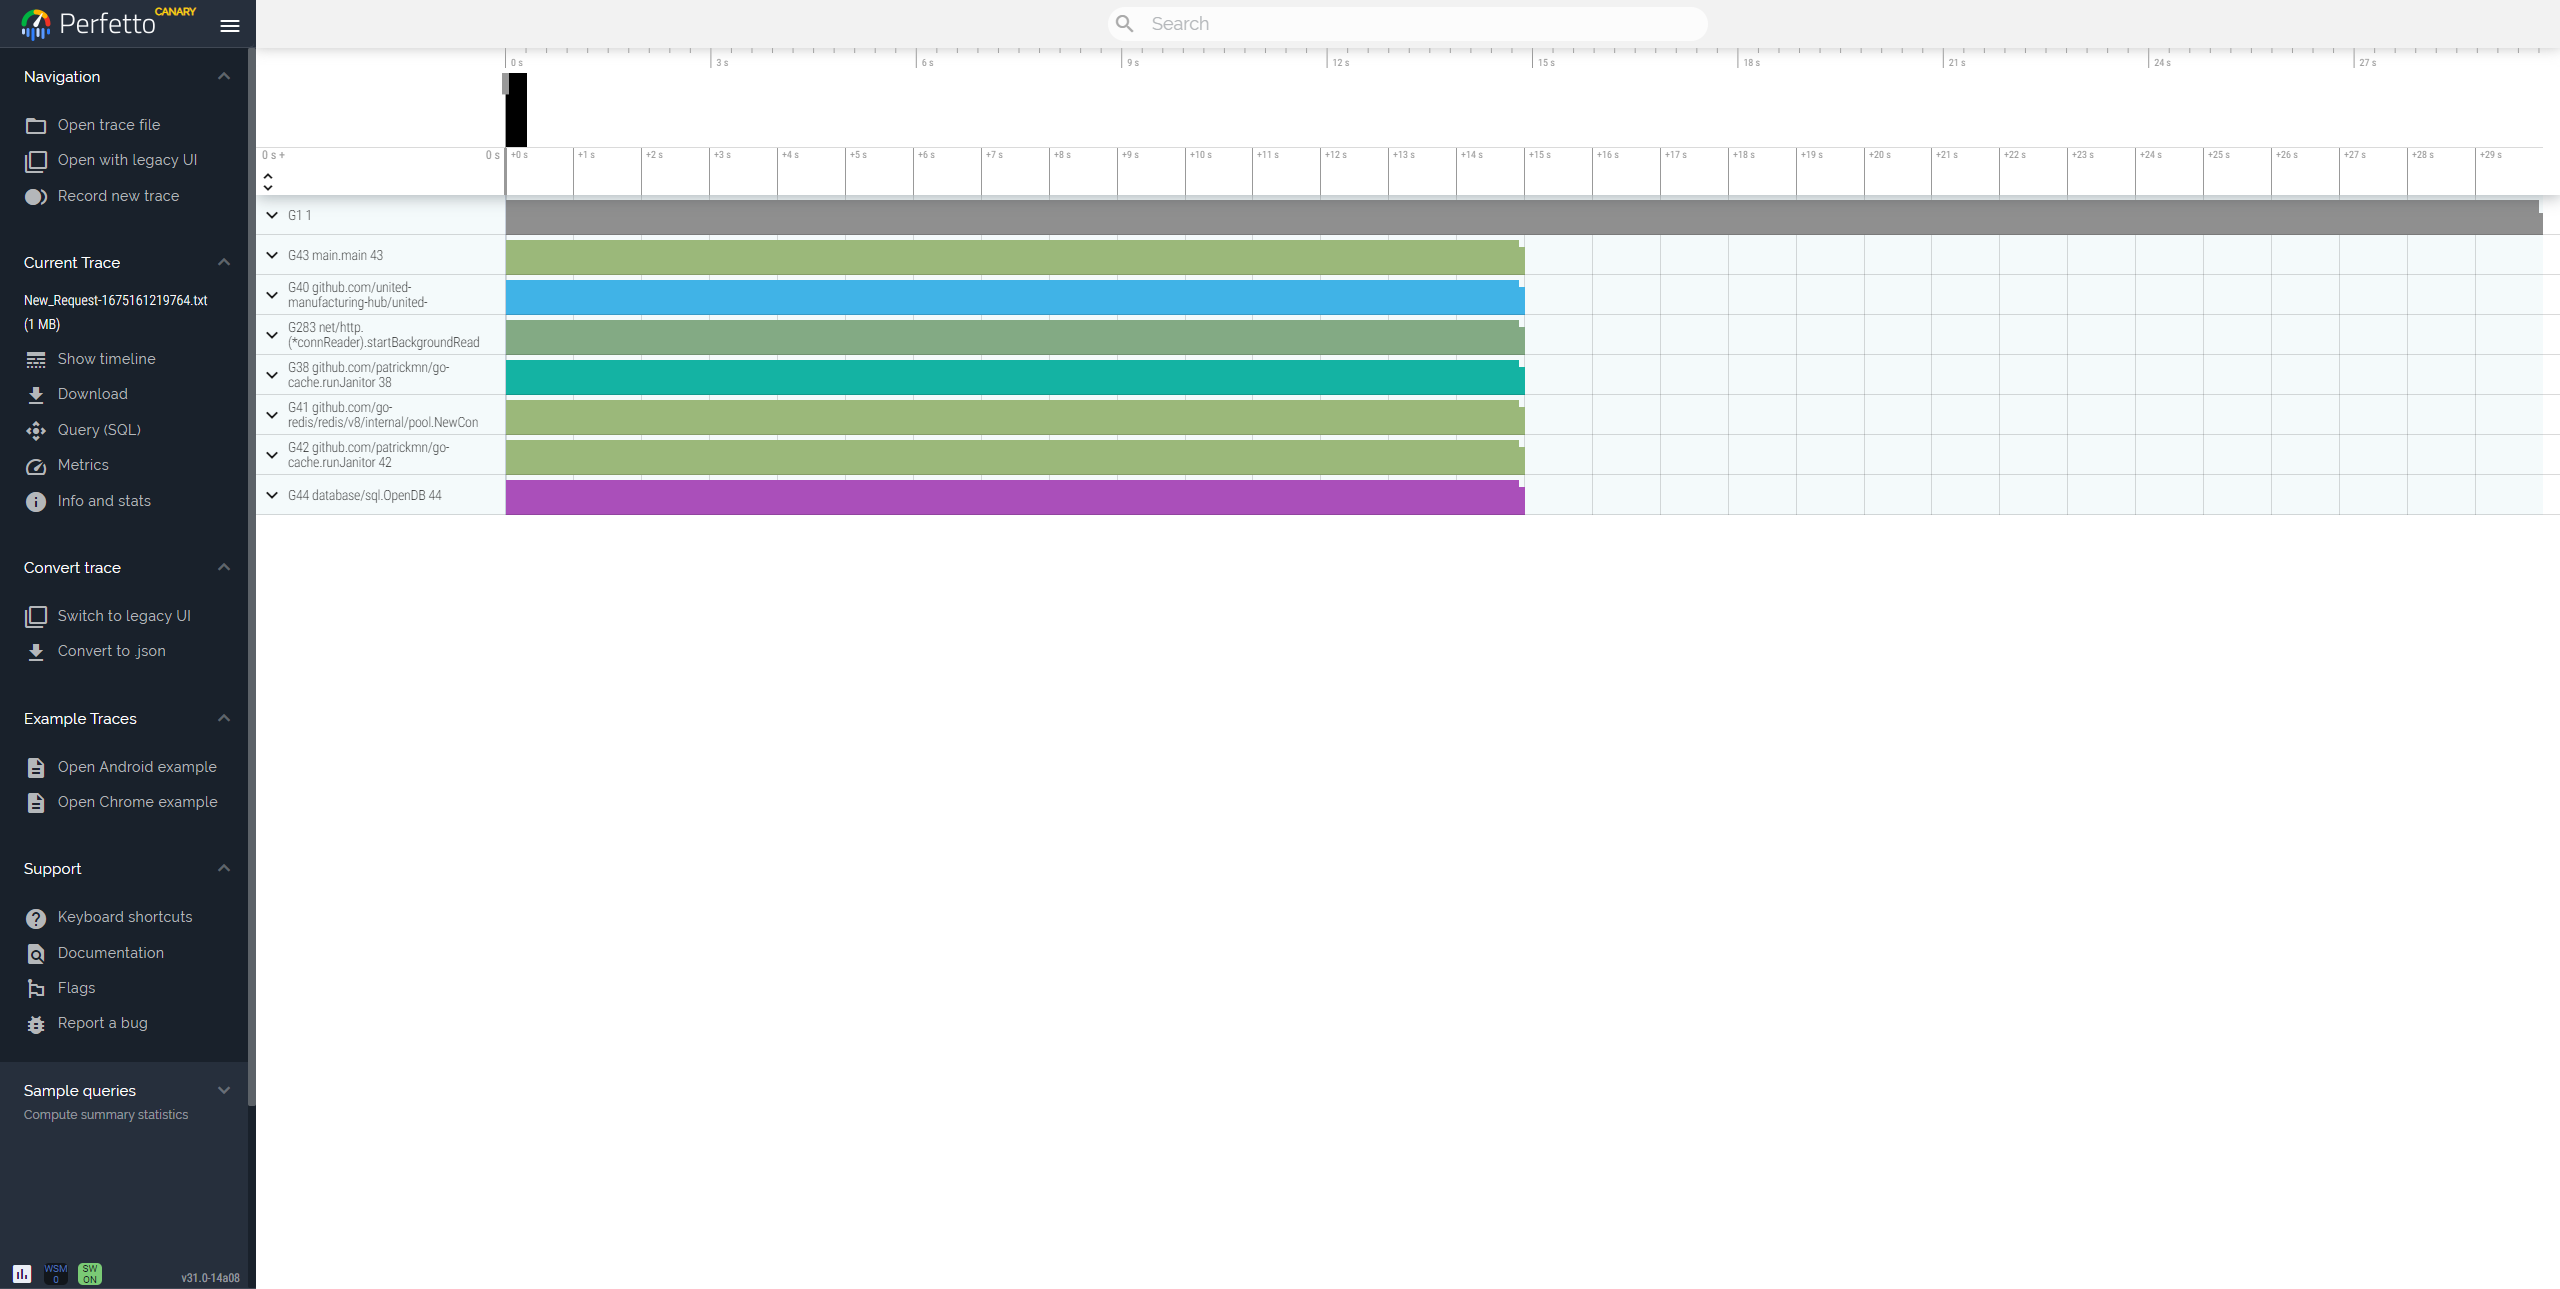
Expanding a goroutine will allow you to view the function calls it made.
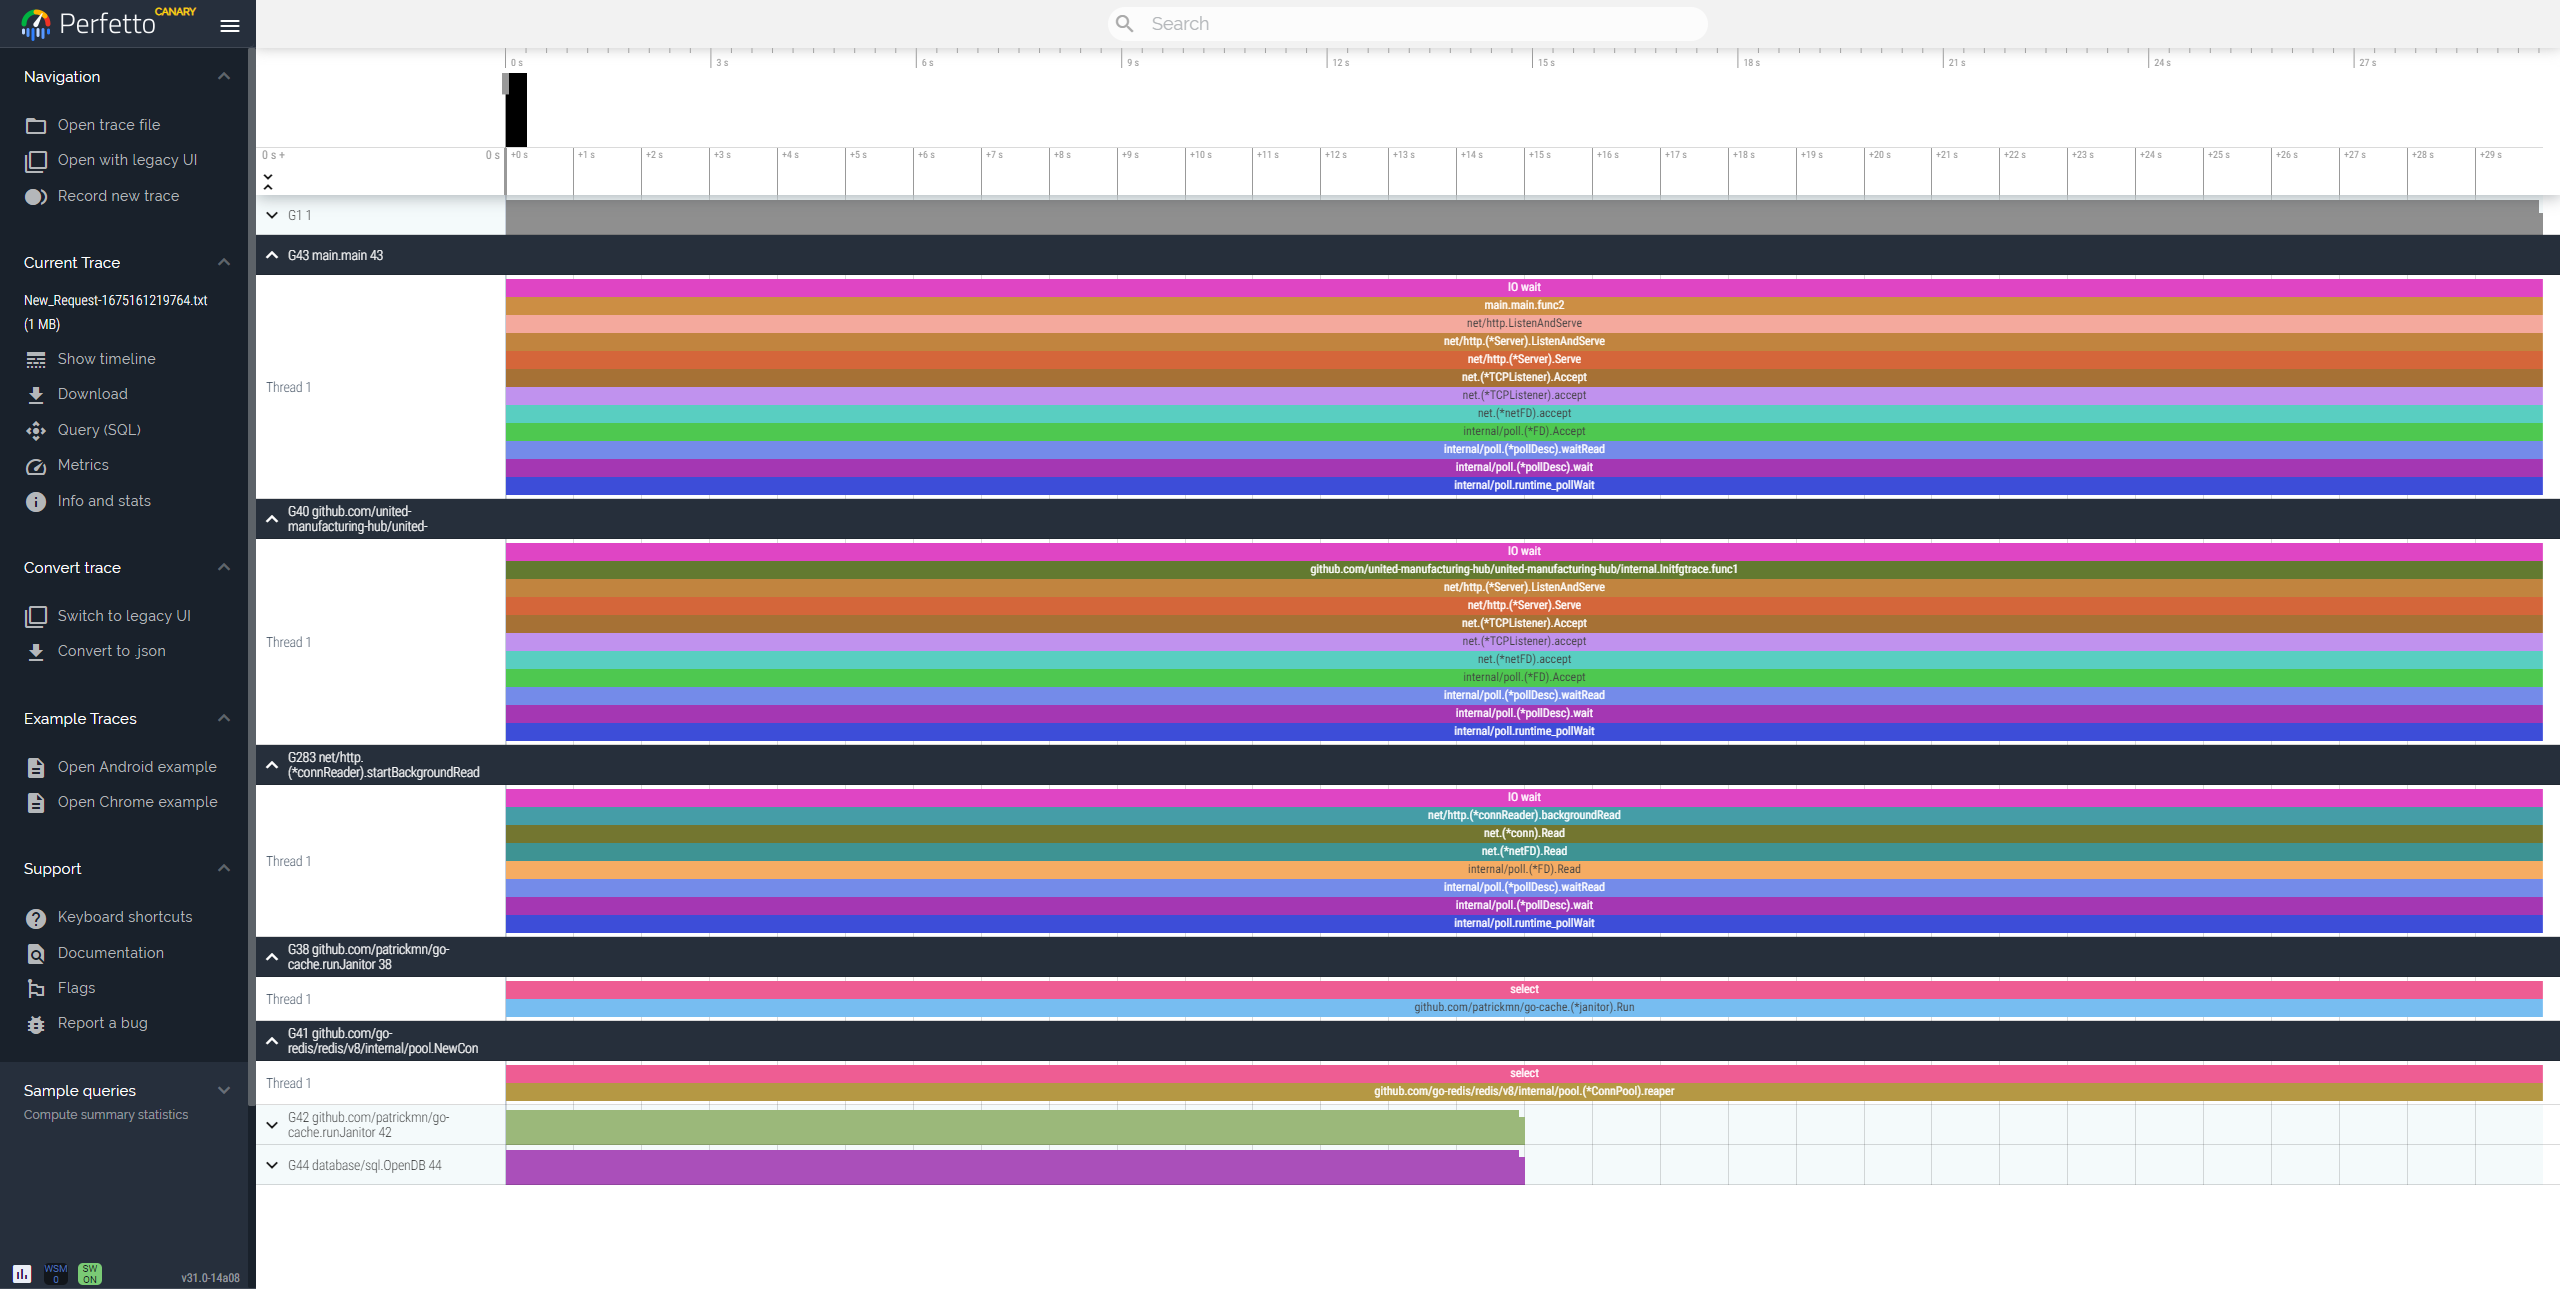
Please note that due to our sampling frequency, function calls that take less than 0.01 seconds will not be captured.
Changing the trace length and frequency
To control the trace length and frequency, you can use the query parameters “seconds” and “hz”.
Last modified April 17, 2023: build: version 0.9.13 (6cb0a01)