Shopfloor KPIs / Analytics
5 minute read
The Shopfloor KPI / Analytics feature of the United Manufacturing Hub provides a configurable and plug-and-play approach to create “Shopfloor Dashboards” for production transparency consisting of various KPIs and drill-downs.
Click on the images to enlarge them. More examples can be found in this YouTube video and in our community-repo on GitHub.
When should I use it?
If you want to create production dashboards that are highly configurable and can drill down into specific KPIs, the Shopfloor KPI / Analytics feature of the United Manufacturing Hub is an ideal choice. This feature is designed to help you quickly and easily create dashboards that provide a clear view of your shop floor performance.
What can I do with it?
The Shopfloor KPI / Analytics feature of the United Manufacturing Hub allows you to:
Query and visualize
In Grafana, you can:
- Calculate the OEE (Overall Equipment Effectiveness) and view trends over time
- Availability is calculated using the formula
(plannedTime - stopTime) / plannedTime, whereplannedTimeis the duration of time for all machines states that do not belong in the Availability or Performance category, andstopTimeis the duration of all machine states configured to be an availability stop. - Performance is calculated using the formula
runningTime / (runningTime + stopTime), whererunningTimeis the duration of all machine states that consider the machine to be running, andstopTimeis the duration of all machine states that are considered a performance loss. Note that this formula does not take into account losses caused by letting the machine run at a lower speed than possible. To approximate this, you can use the LowSpeedThresholdInPcsPerHour configuration option (see further below). - Quality is calculated using the formula
good pieces / total pieces
- Availability is calculated using the formula
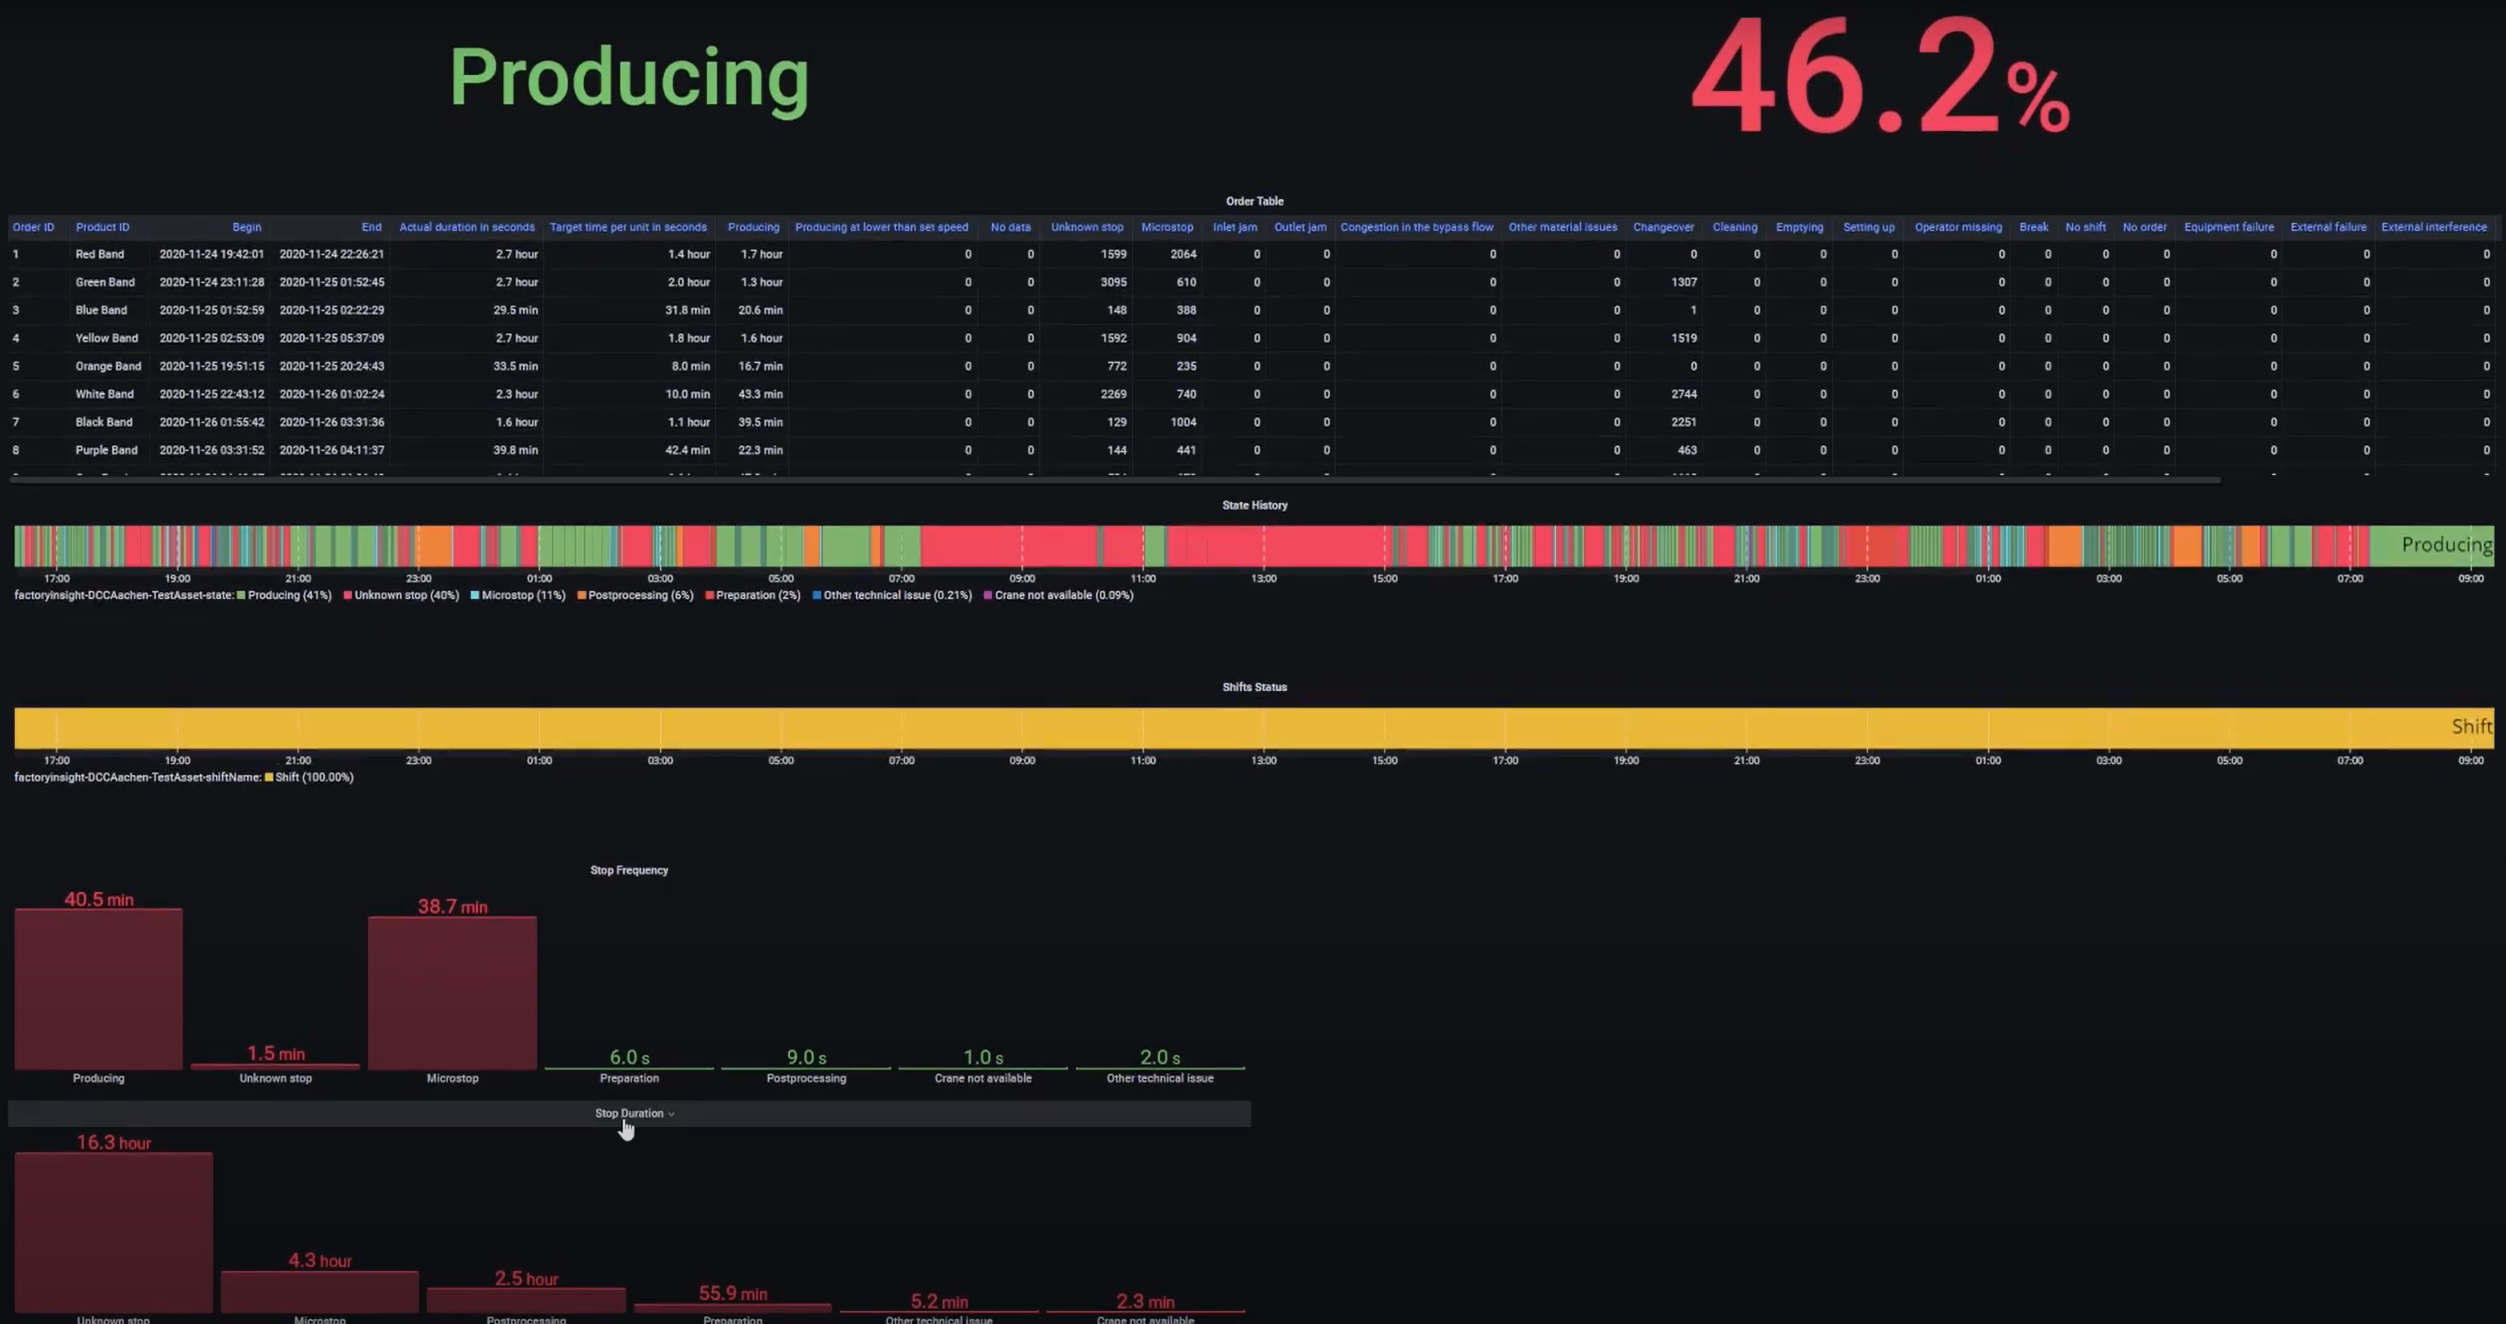
- Drill down into stop reasons (including histograms) to identify the root-causes for a potentially low OEE.
- List all produced and planned orders including target vs actual produced pieces, total production time, stop reasons per order, and more using job and product tables.
- See machine states, shifts, and orders on timelines to get a clear view of what happened during a specific time range.
- View production speed and produced pieces over time.
Configure
In the database, you can configure:
- Stop Reasons Configuration: Configure which stop reasons belong into which category for the OEE calculation and whether they should be included in the OEE calculation at all. For instance, some companies define changeovers as availability losses, some as performance losses. You can easily move them into the correct category.
- Automatic Detection and Classification: Configure whether to automatically detect/classify certain types of machine states and stops:
- AutomaticallyIdentifyChangeovers: If the machine state was an unspecified machine stop (UnknownStop), but an order was recently started, the time between the start of the order until the machine state turns to running, will be considered a Changeover Preparation State (10010). If this happens at the end of the order, it will be a Changeover Post-processing State (10020).
- MicrostopDurationInSeconds: If an unspecified stop (UnknownStop) has a duration smaller than a configurable threshold (e.g., 120 seconds), it will be considered a Microstop State (50000) instead. Some companies put small unknown stops into a different category (performance) than larger unknown stops, which usually land up in the availability loss bucket.
- IgnoreMicrostopUnderThisDurationInSeconds: In some cases, the machine can actually stop for a couple of seconds in routine intervals, which might be unwanted as it makes analysis difficult. One can set a threshold to ignore microstops that are smaller than a configurable threshold (usually like 1-2 seconds).
- MinimumRunningTimeInSeconds: Same logic if the machine is running for a couple of seconds only. With this configurable threshold, small run-times can be ignored. These can happen, for example, during the changeover phase.
- ThresholdForNoShiftsConsideredBreakInSeconds: If no shift was planned, an UnknownStop will always be classified as a NoShift state. Some companies move smaller NoShift’s into their category called “Break” and move them either into Availability or Performance.
- LowSpeedThresholdInPcsPerHour: For a simplified performance calculation, a threshold can be set, and if the machine has a lower speed than this, it could be considered a LowSpeedState and could be categorized into the performance loss bucket.
- Language Configuration: The language of the machine states can be configured using the languageCode configuration option (or overwritten in Grafana).
You can find the configuration options in the configurationTable
How can I use it?
Using it is very easy:
- Send messages according to the UMH datamodel to the Unified Namespace (similar to the Historian feature)
- Configure your OEE calculation by adjusting the configuration table
- Open Grafana, select your equipment and select the analysis you want to have. More information can be found in the umh-datasource-v2.
For more information about what exactly is behind the Analytics feature, check out our our architecture page and our datamodel
What are the limitations?
At the moment, the limitations are:
- Speed losses in Performance are not calculated and can only be approximated using the LowSpeedThresholdInPcsPerHour configuration option
- There is no way of tracking losses through reworked products. Either a product is scrapped or not.
Where to get more information?
- Learn more about the benefits of using open-source databases in our blog article, Historians vs Open-Source databases - which is better?
- Learn more about the United Manufacturing Hub’s architecture by visiting our architecture page.
- Learn more about the datamodel by visiting our datamodel
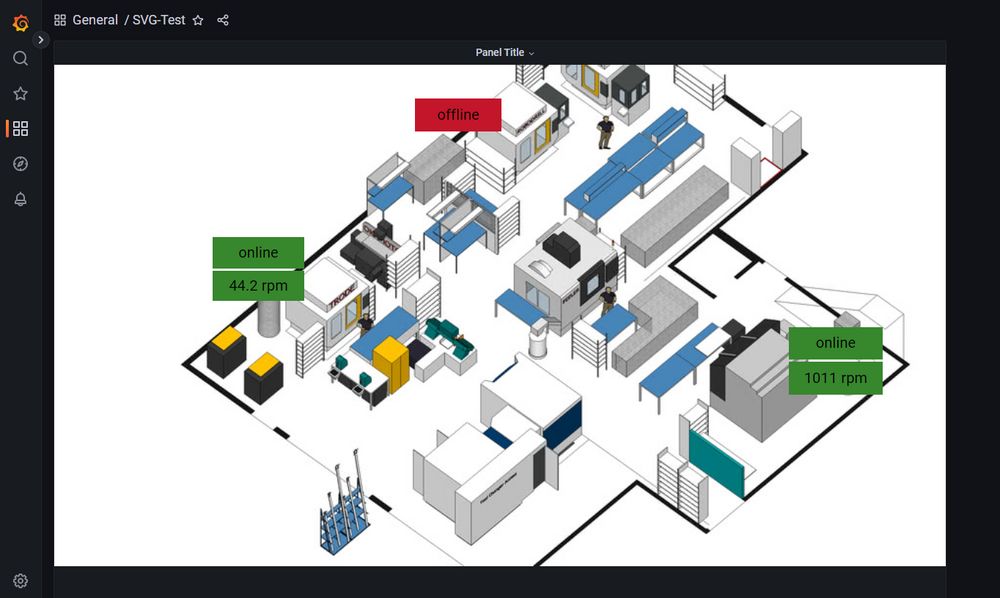
- To build visual dashboards, check out our tutorial on using Grafana Canvas