4. Data Visualization
2 minute read
The next step is to visualize the data. In this chapter, we will be creating a Grafana dashboard that is based on the Node-RED flow we created in the previous chapter. The dashboard will display the temperature readings and temperature warnings.
Creating a Grafana dashboard
Open Grafana with UMHLens and enter the secrets also found in UMHLens.
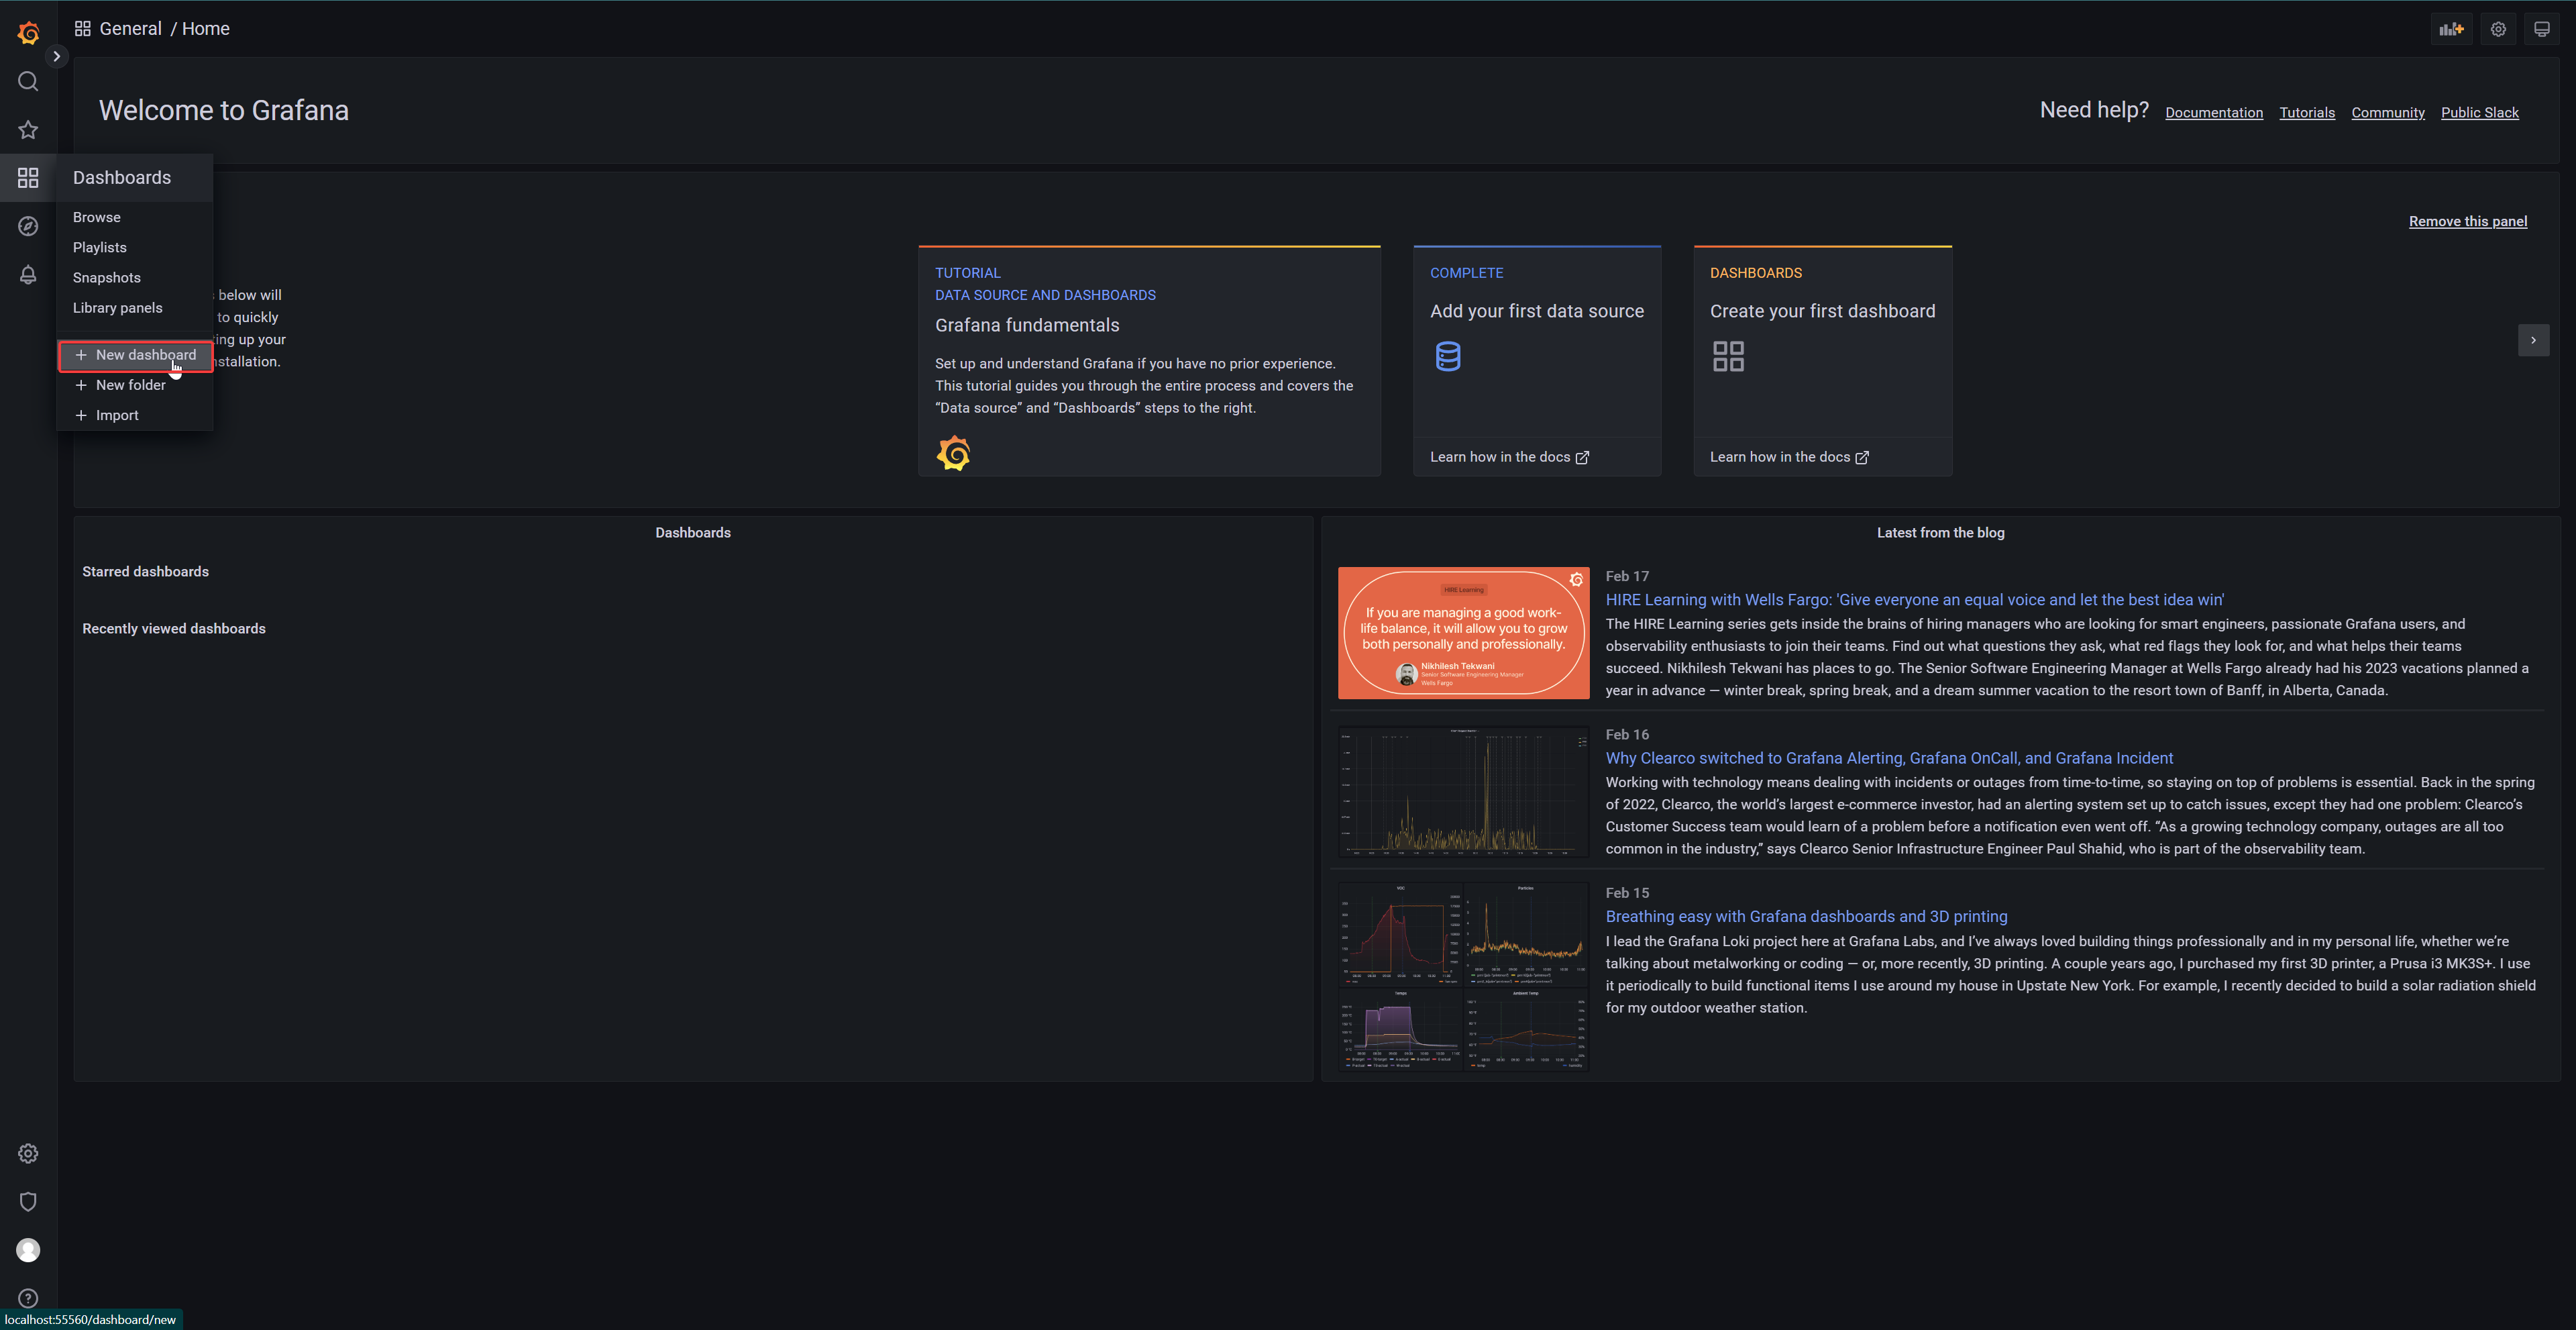
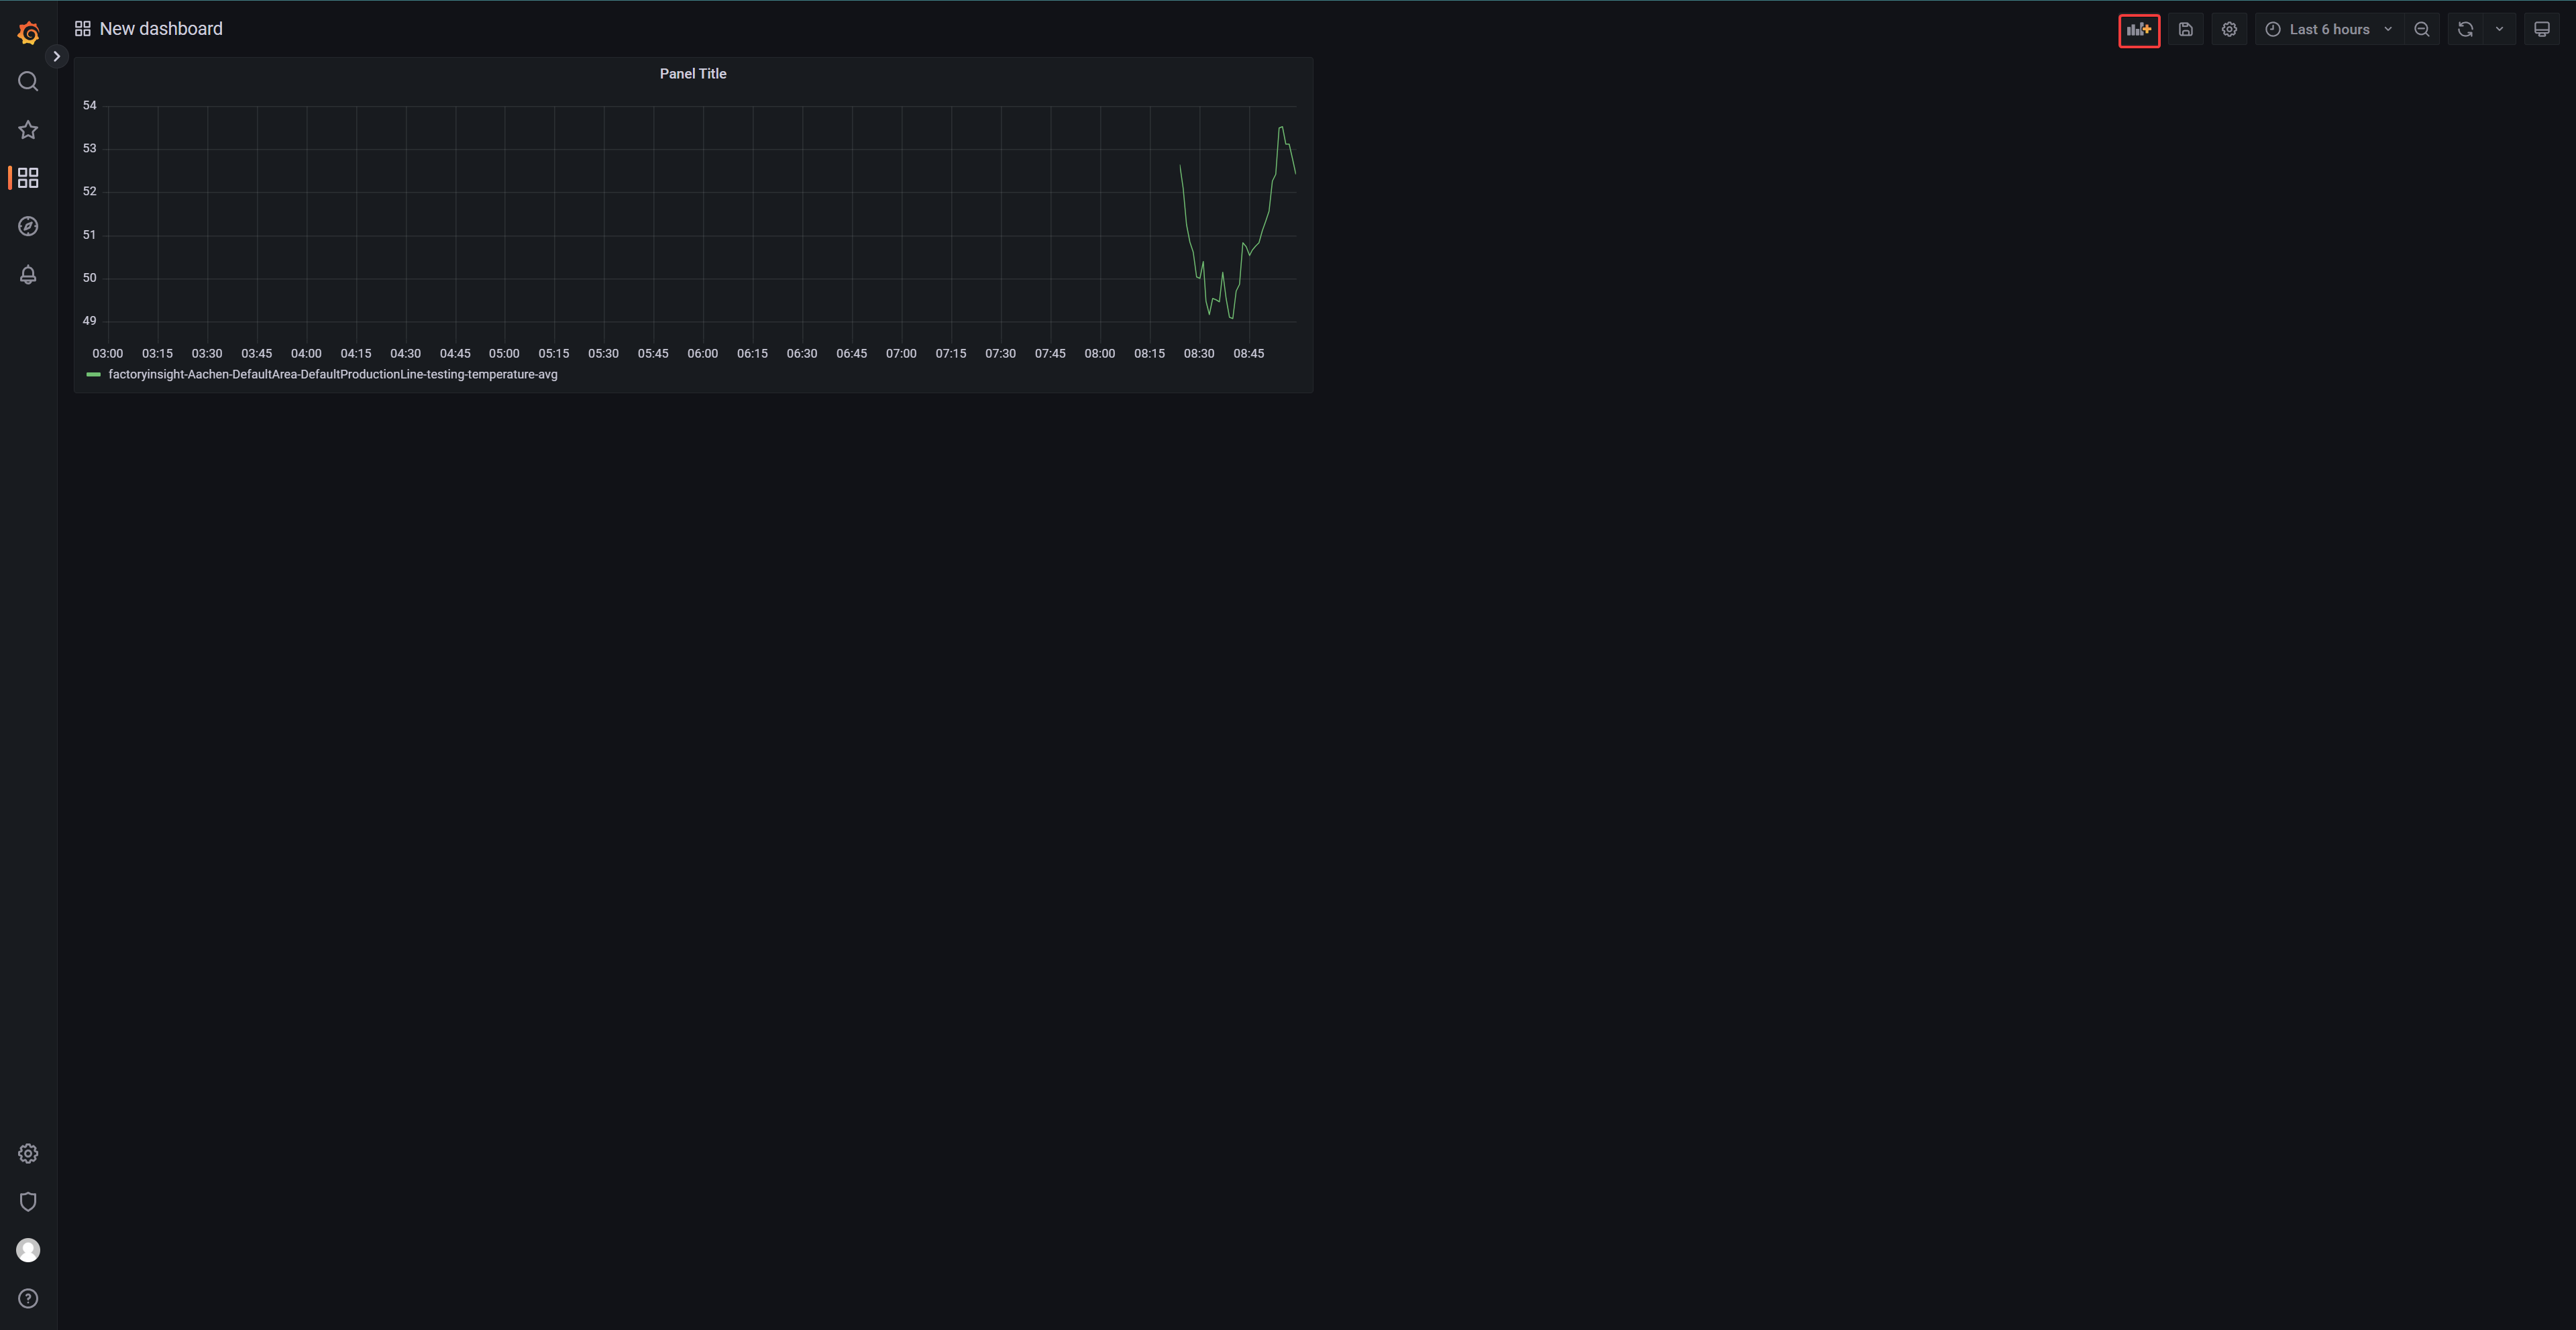
Once you are in Grafana navigate to the left and click on New dashboard.
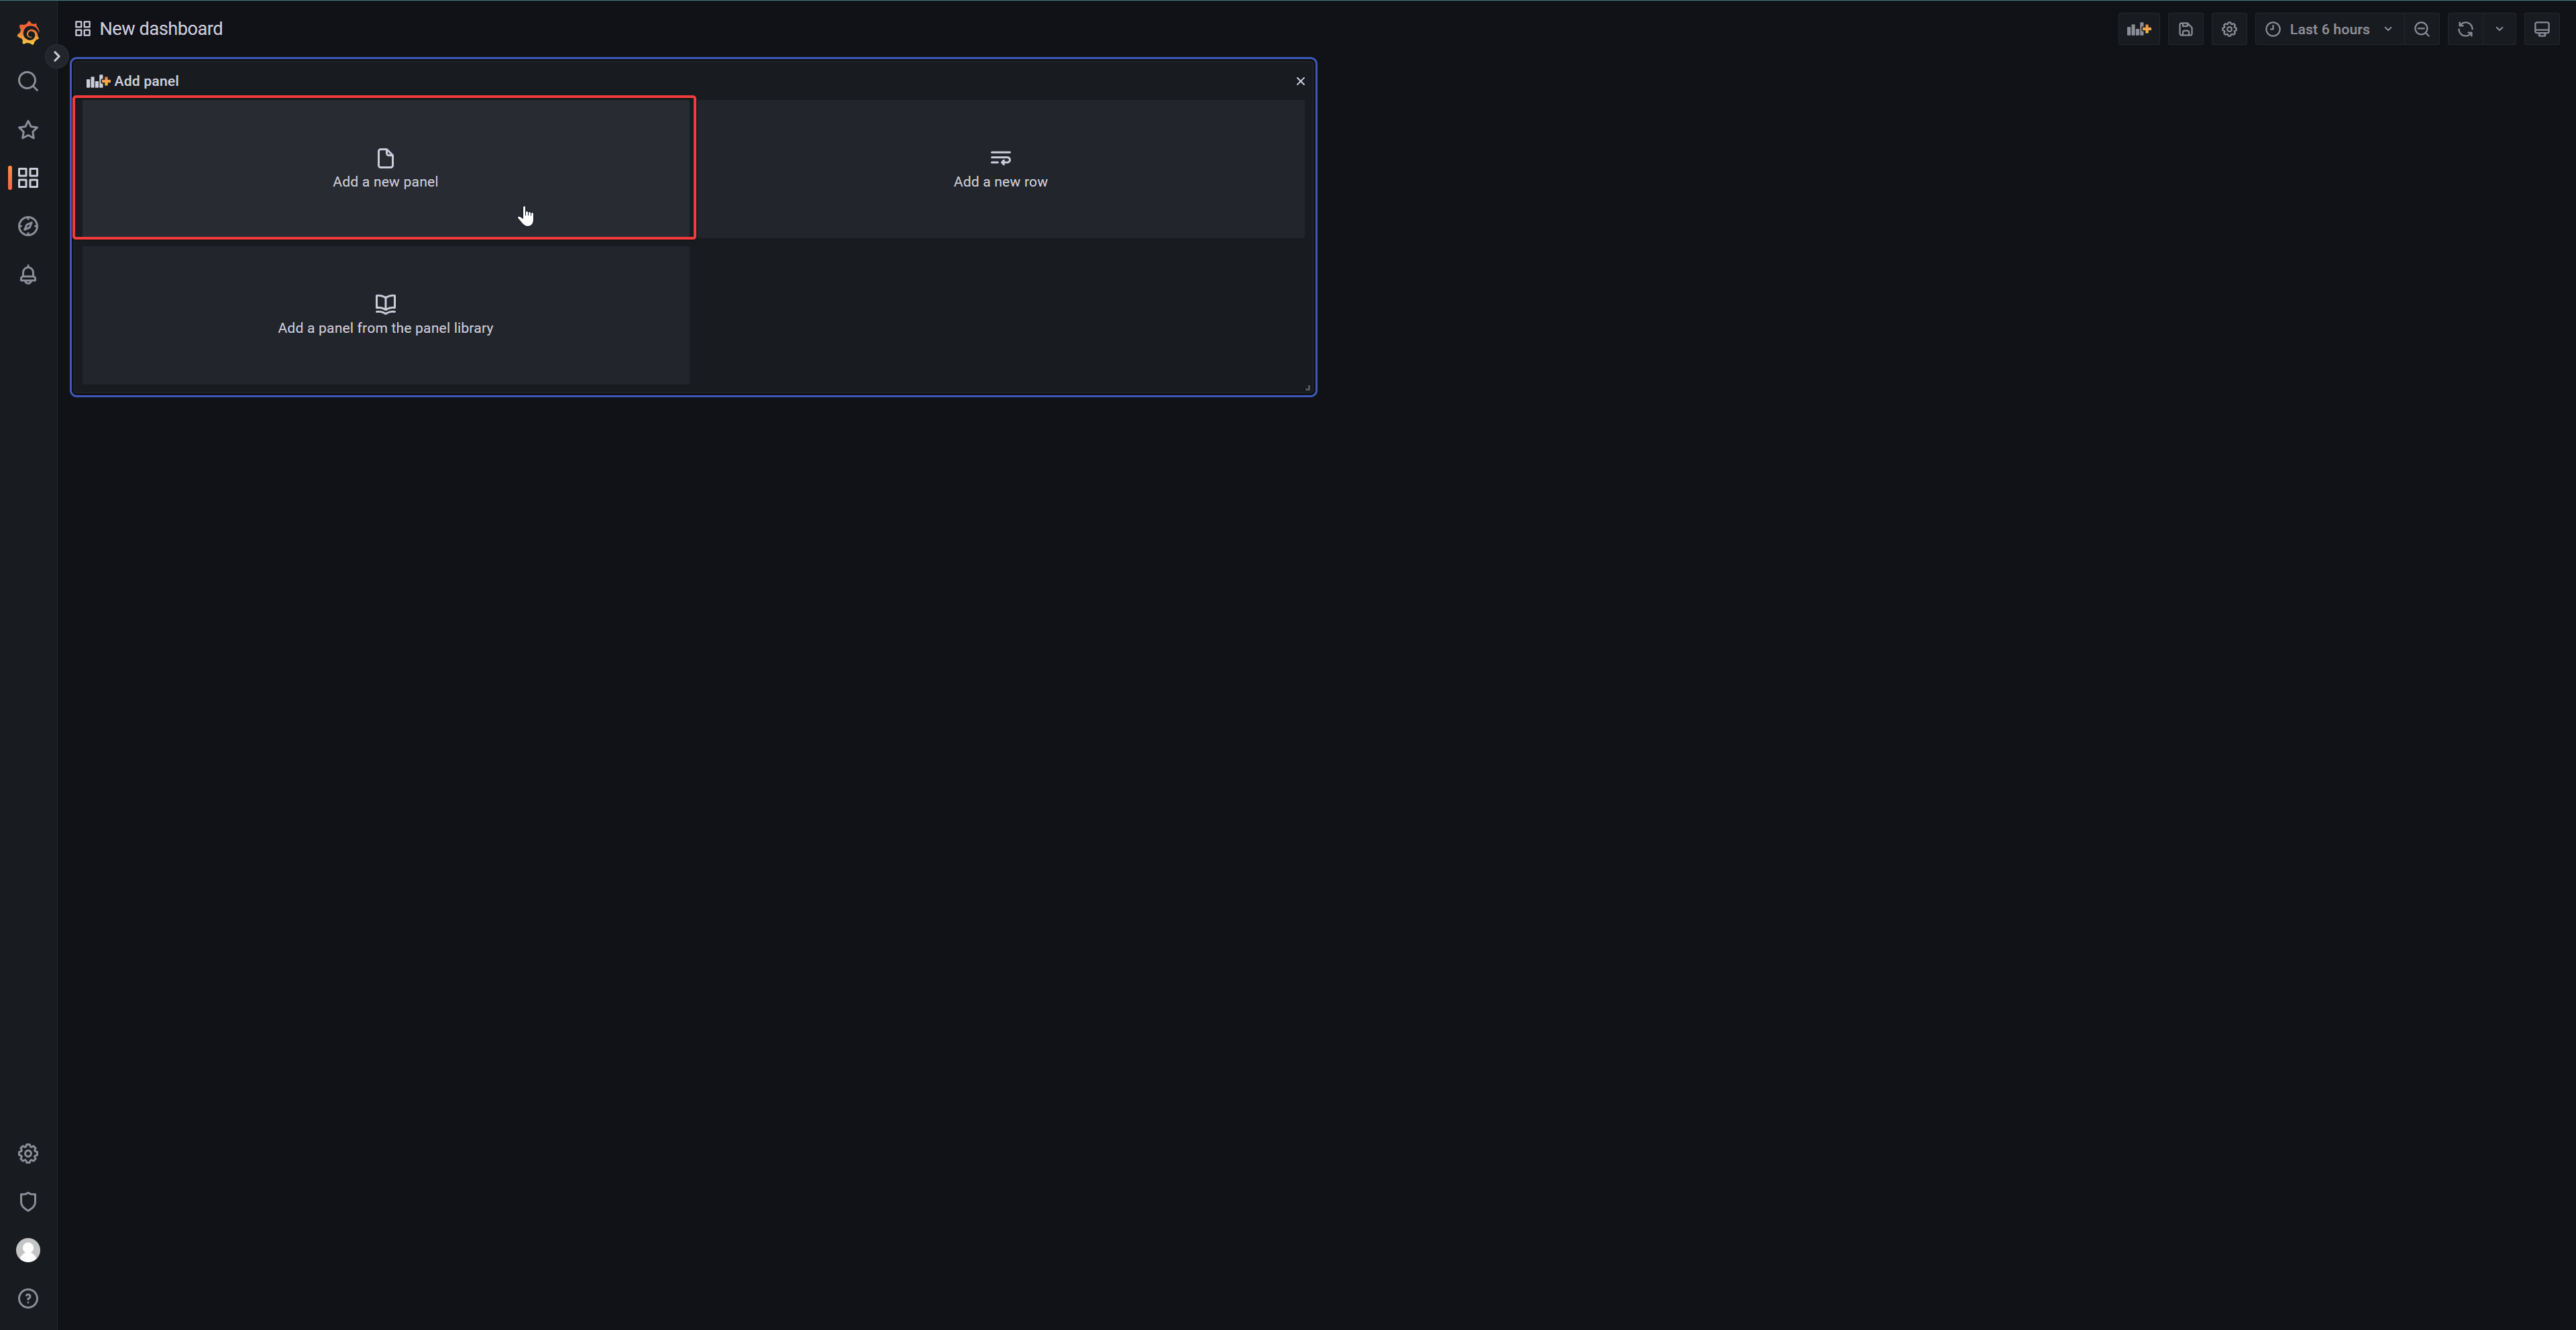
Click on Add a new panel.
Next we will configure the datasource-v2, to retrieve the data we earlier transformed in Node-red. Click on umh-v2-datasource.
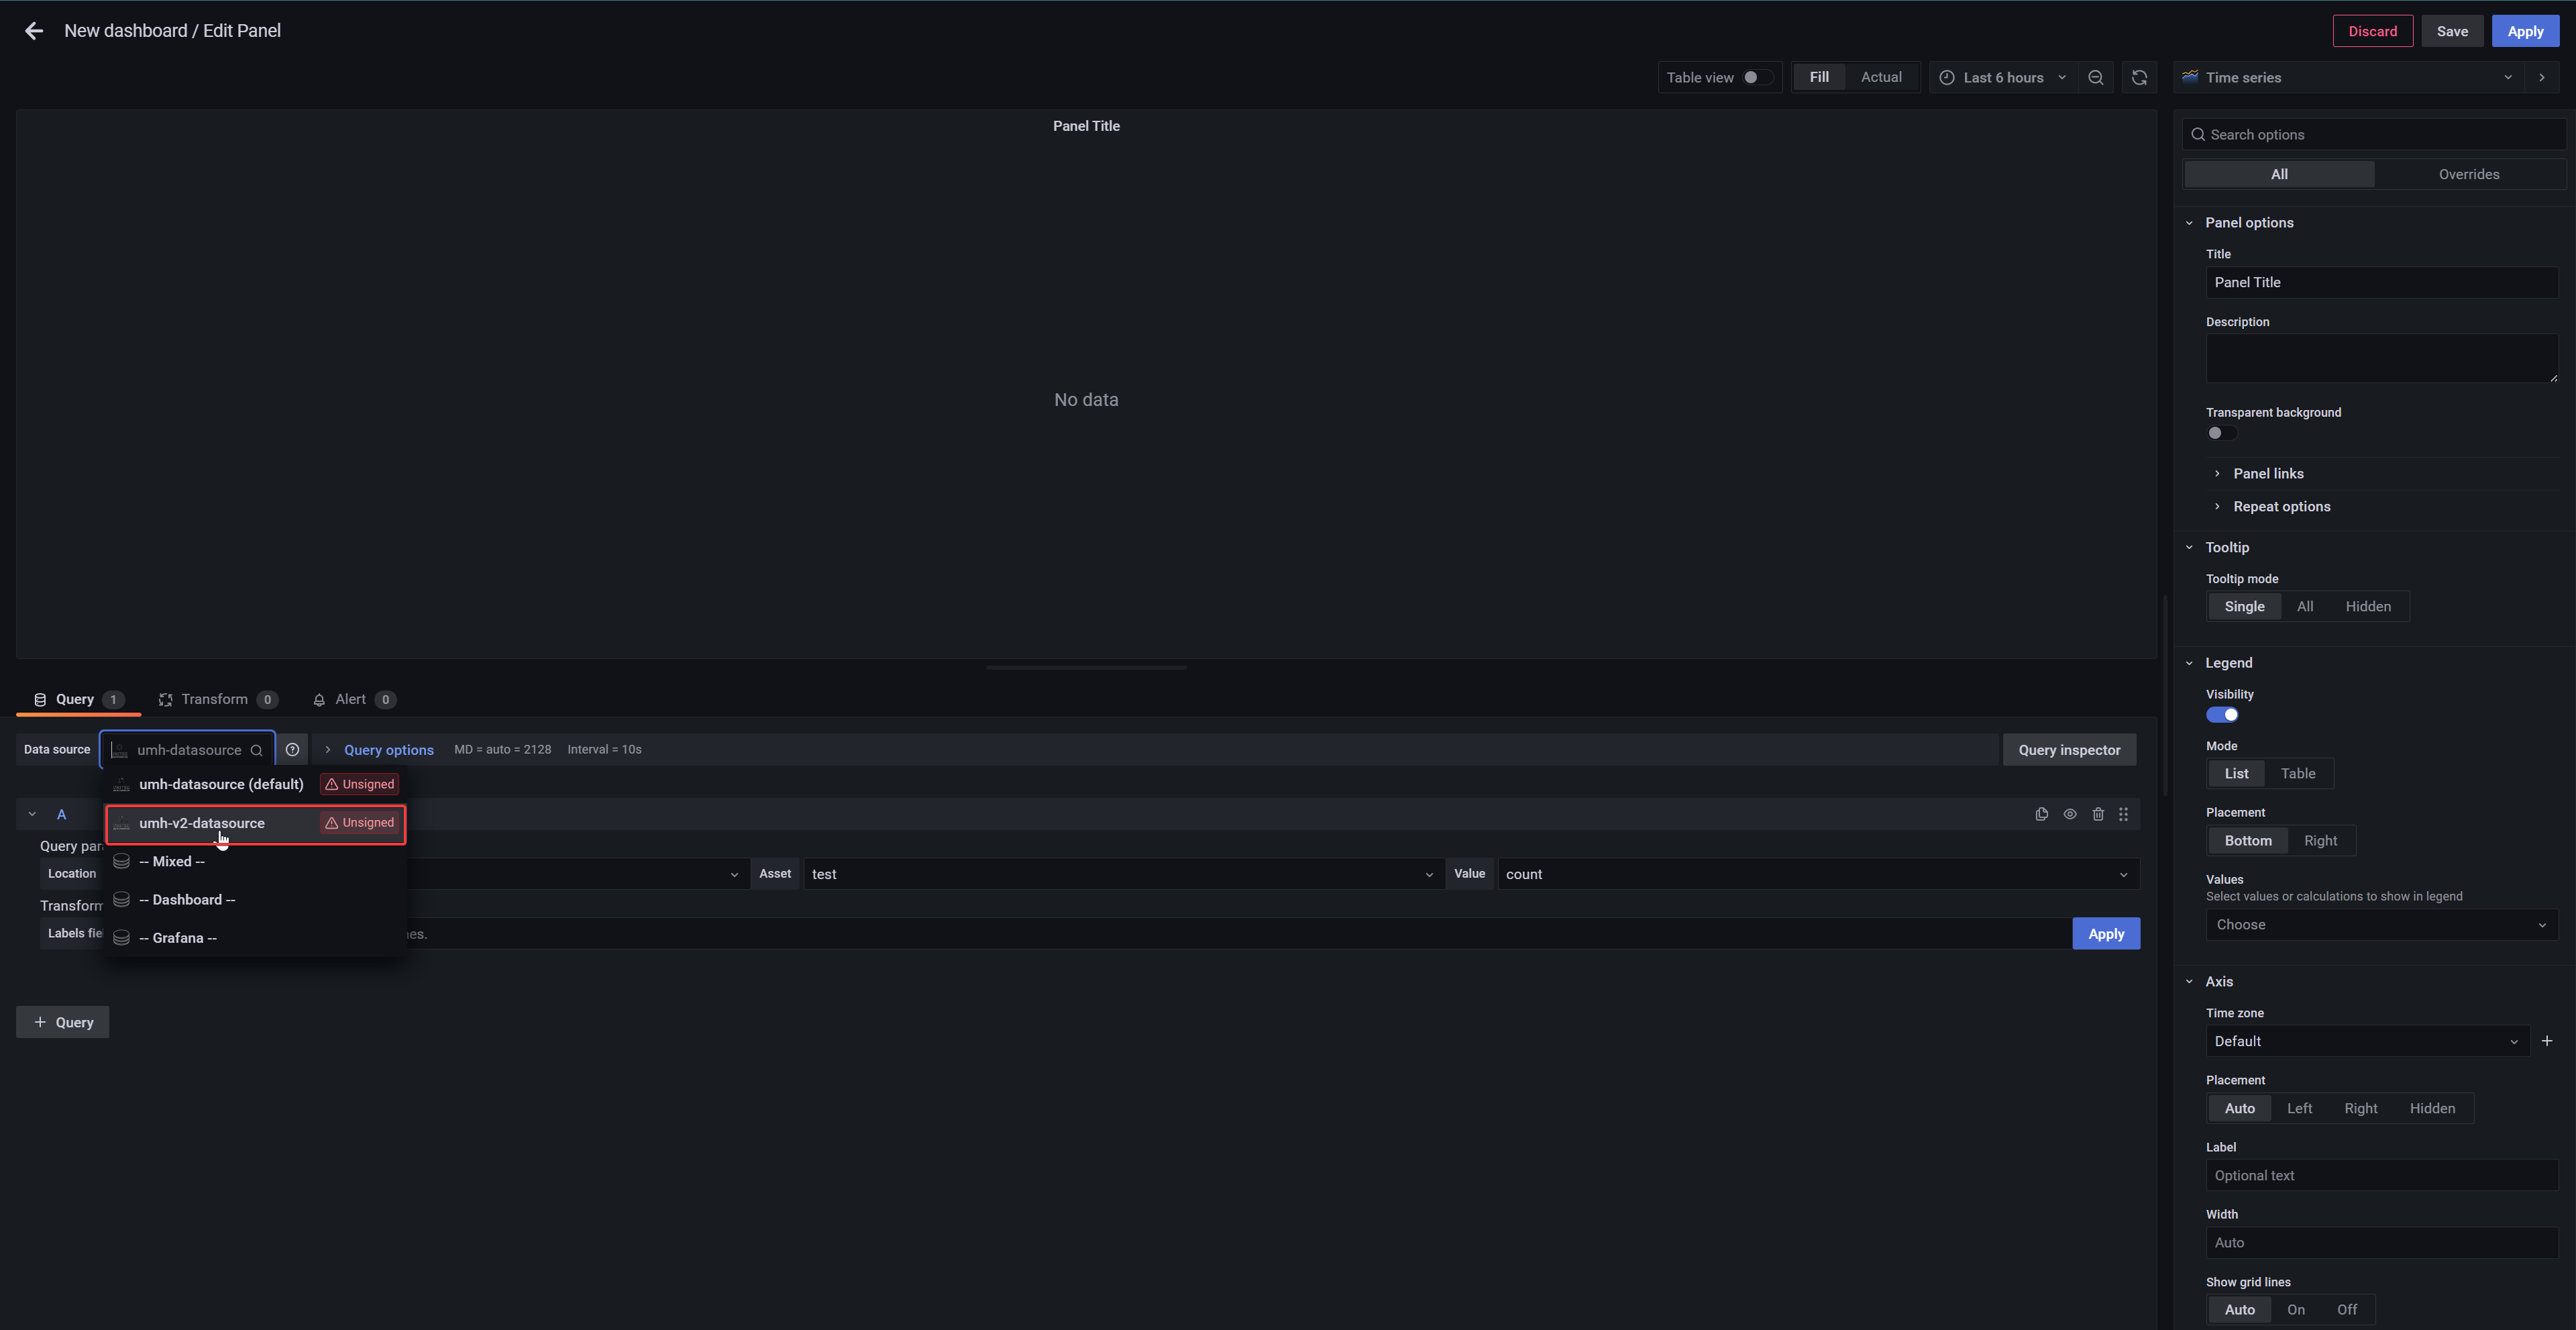
Go to Work cell to query and select under Select new work cell: factoryinsight->Aachen->DefaultArea->DefaultProductionLine->testing
Next go to Value to query and select under Select new value: tags->custom->temperature .
If you now click on Refresh Dashboard at the top right-hand corner, the graph will refresh and display the temperature data.
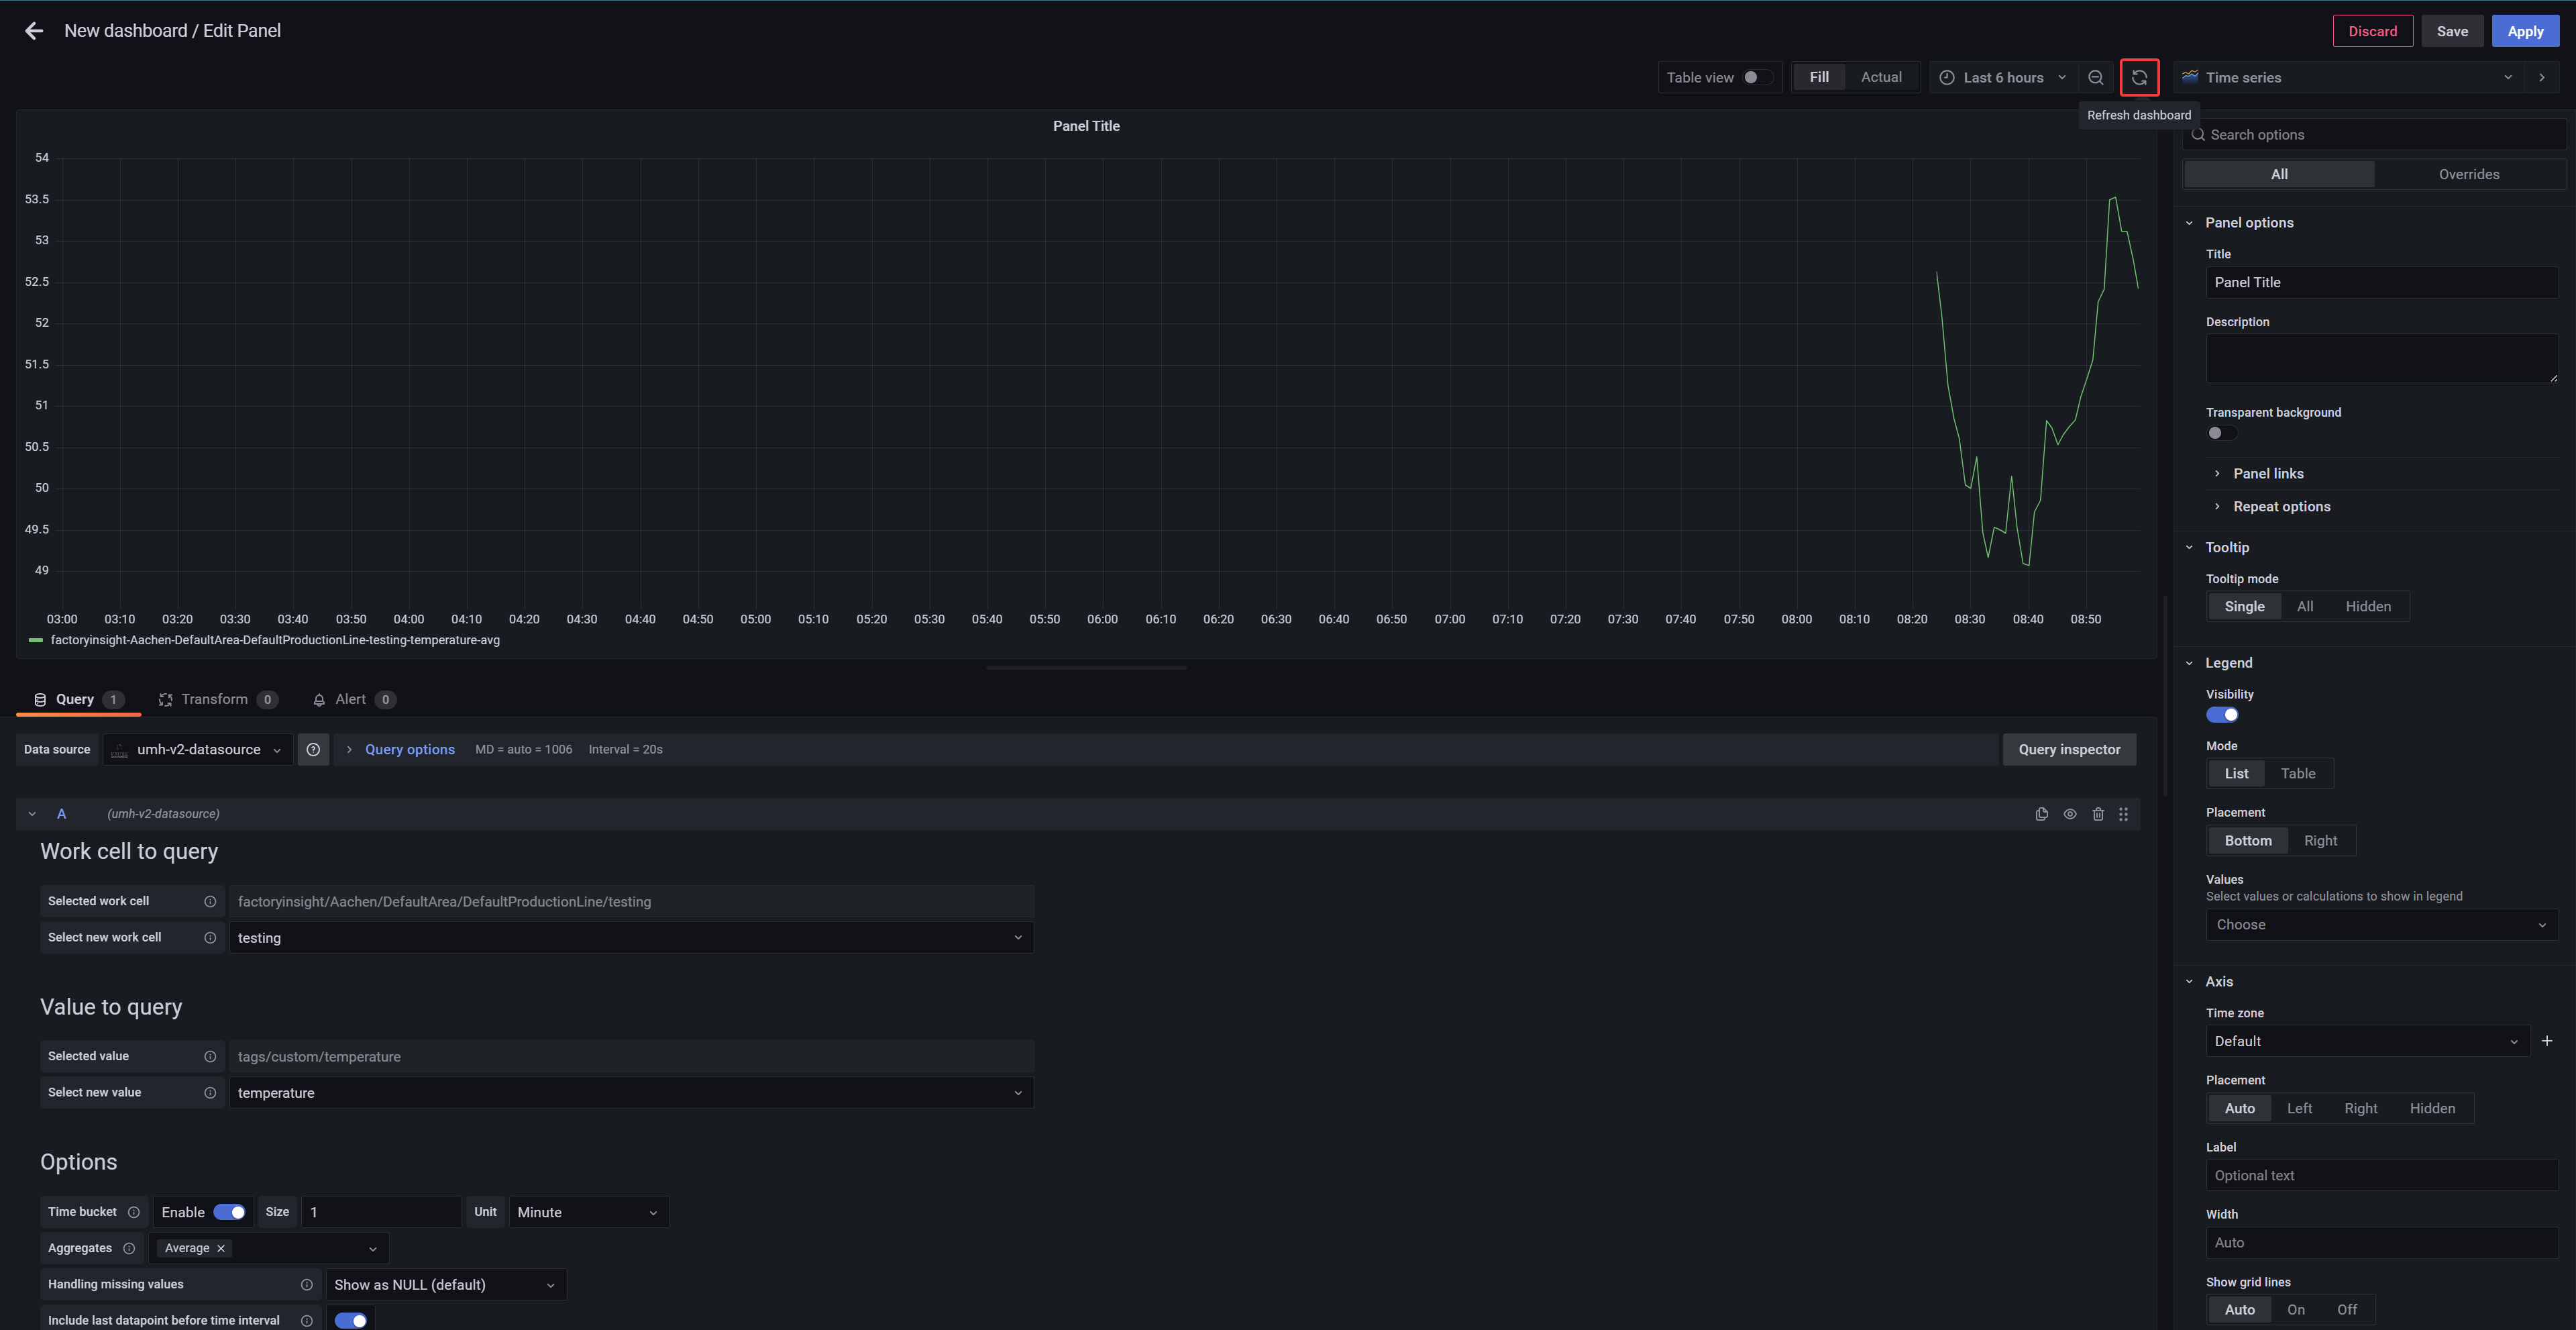
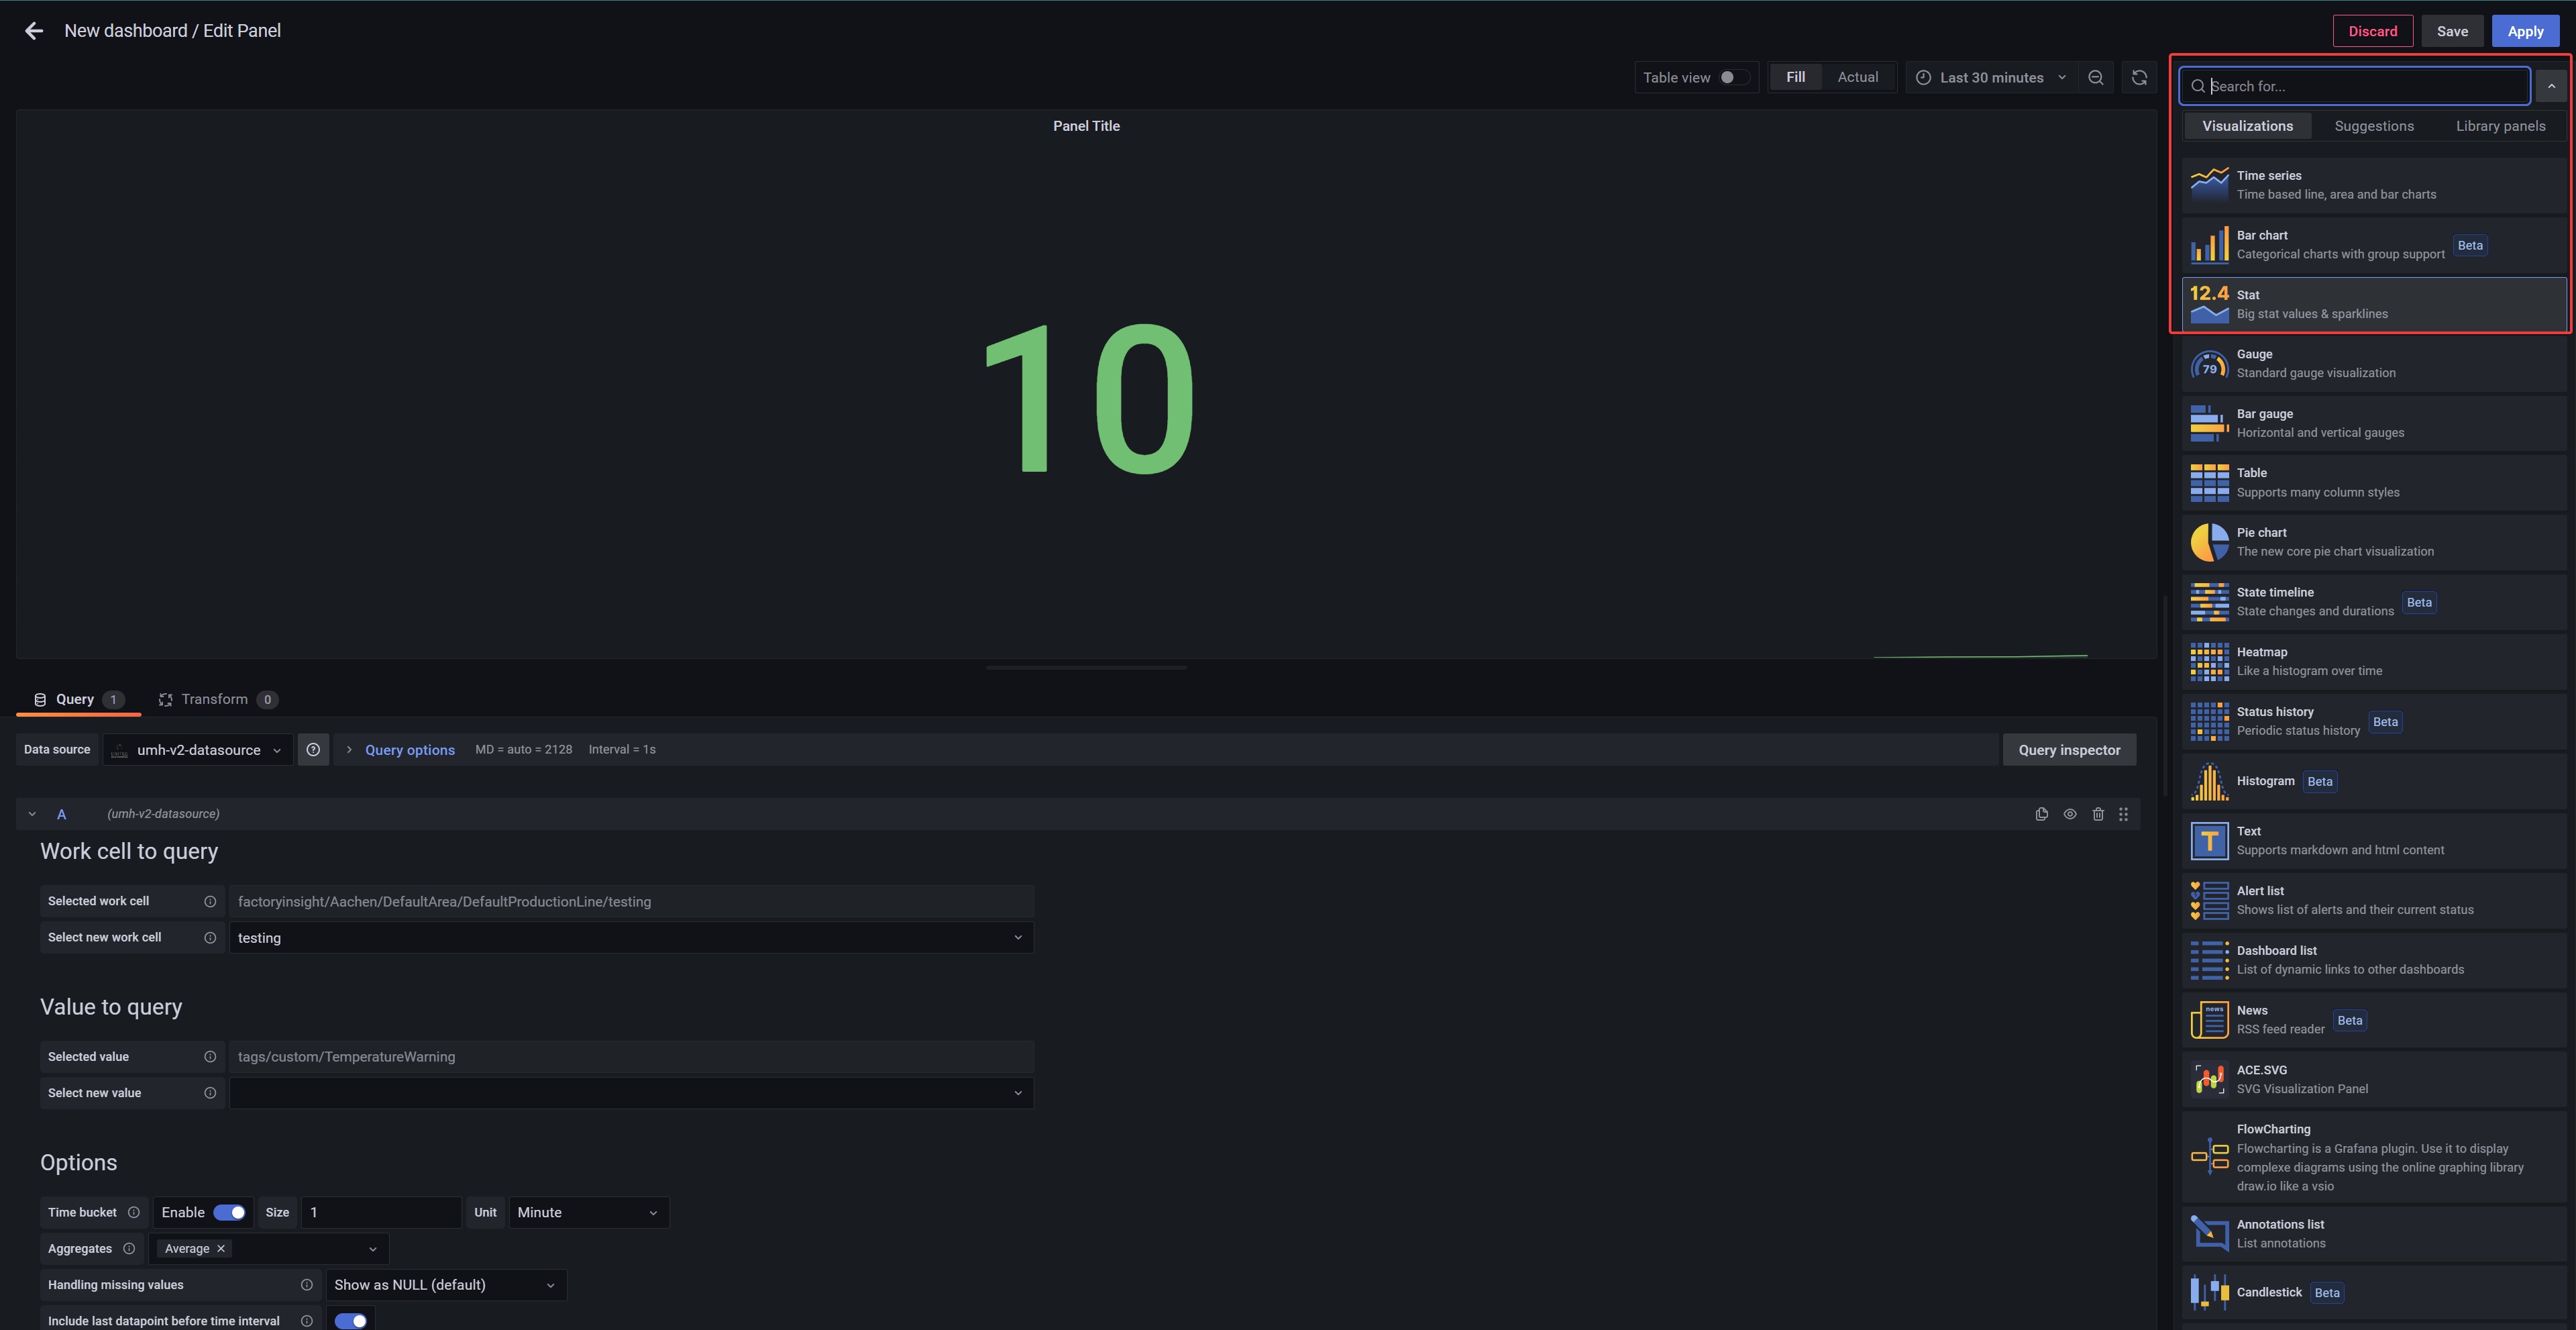
Next, you can customise your dashboard. On the right side are several options, such as specifying a unit or setting thresholds, etc. Just play around until it suits your needs.
When you have finished making adjustments, click Apply in the top right-hand corner to save the panel and return to the overview.
Next we will display the temperature warnings. Click Add Panel at the top right to create an additional panel.
To set up the umh-v2 data source, repeat the steps discussed earlier, but select under Value to query: TemperatureWarning instead of temperature.
instead of a time series chart to display the temperature warnings, we select Stat on the right side.
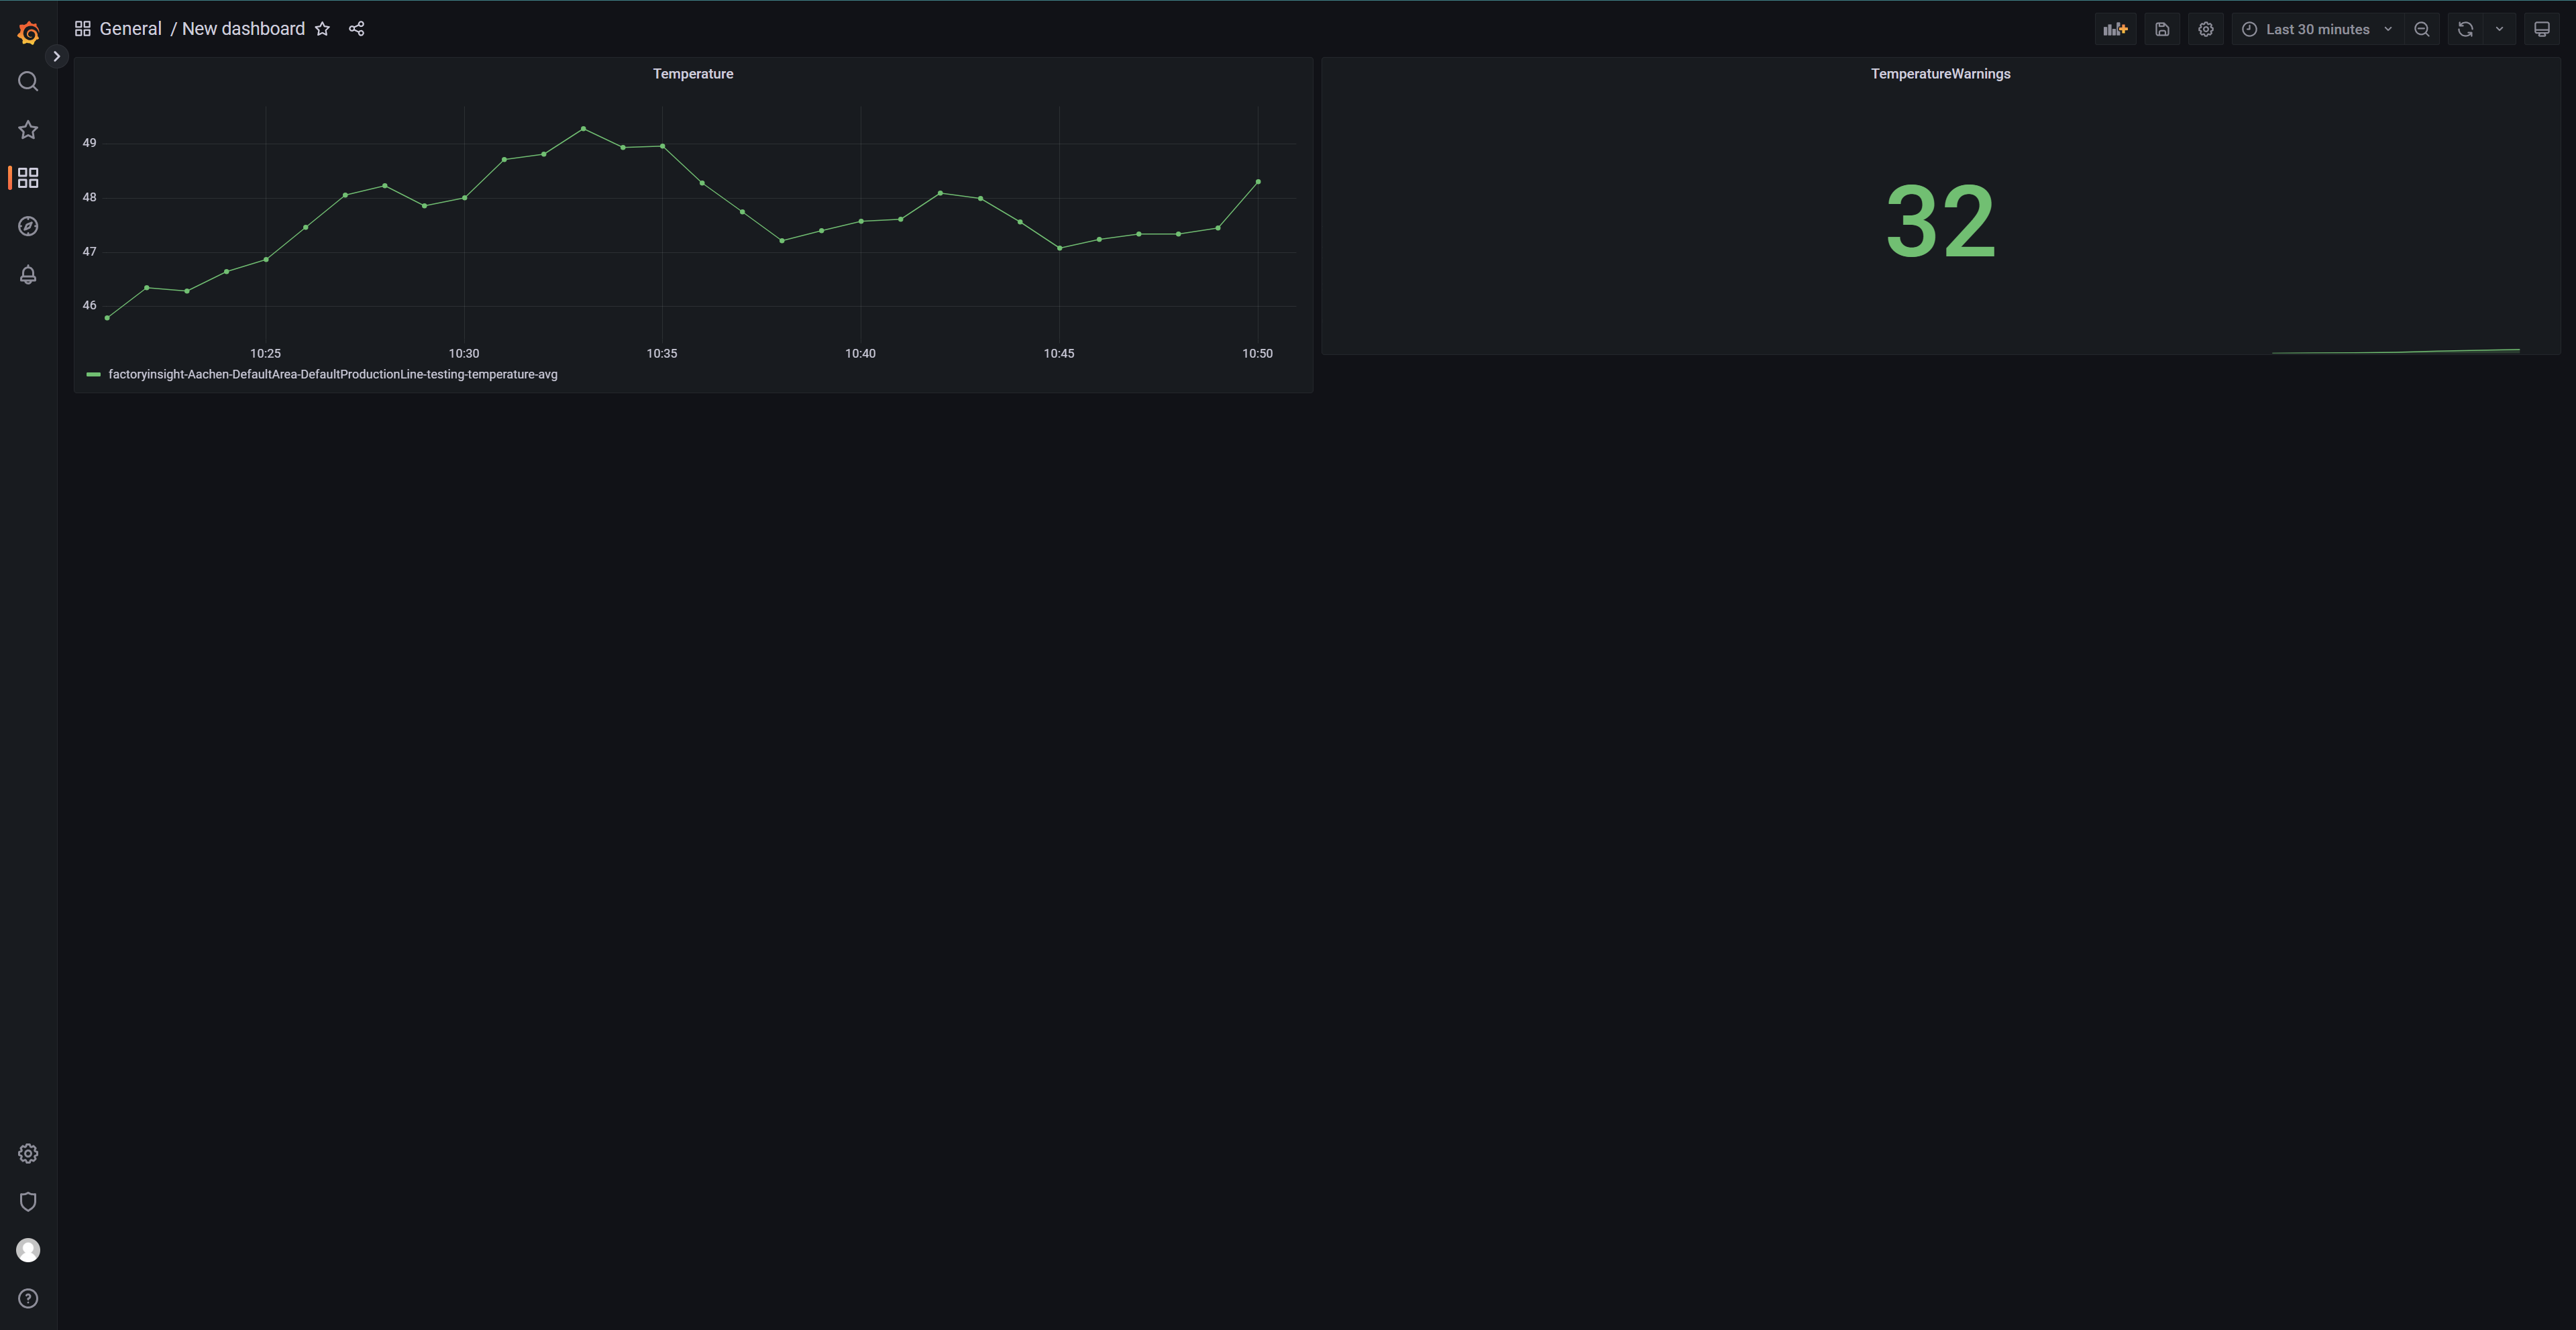
Now you can again customize your panel and when you are done click on Apply.
Congratulations, you have created your first Grafana dashboard, and it should look something like the one below.
What’s next?
The next topic is “Moving to Production”, where we will explain what it means to move the umh to a manufacturing environment. Click here to proceed.