2. Managing the System
2 minute read
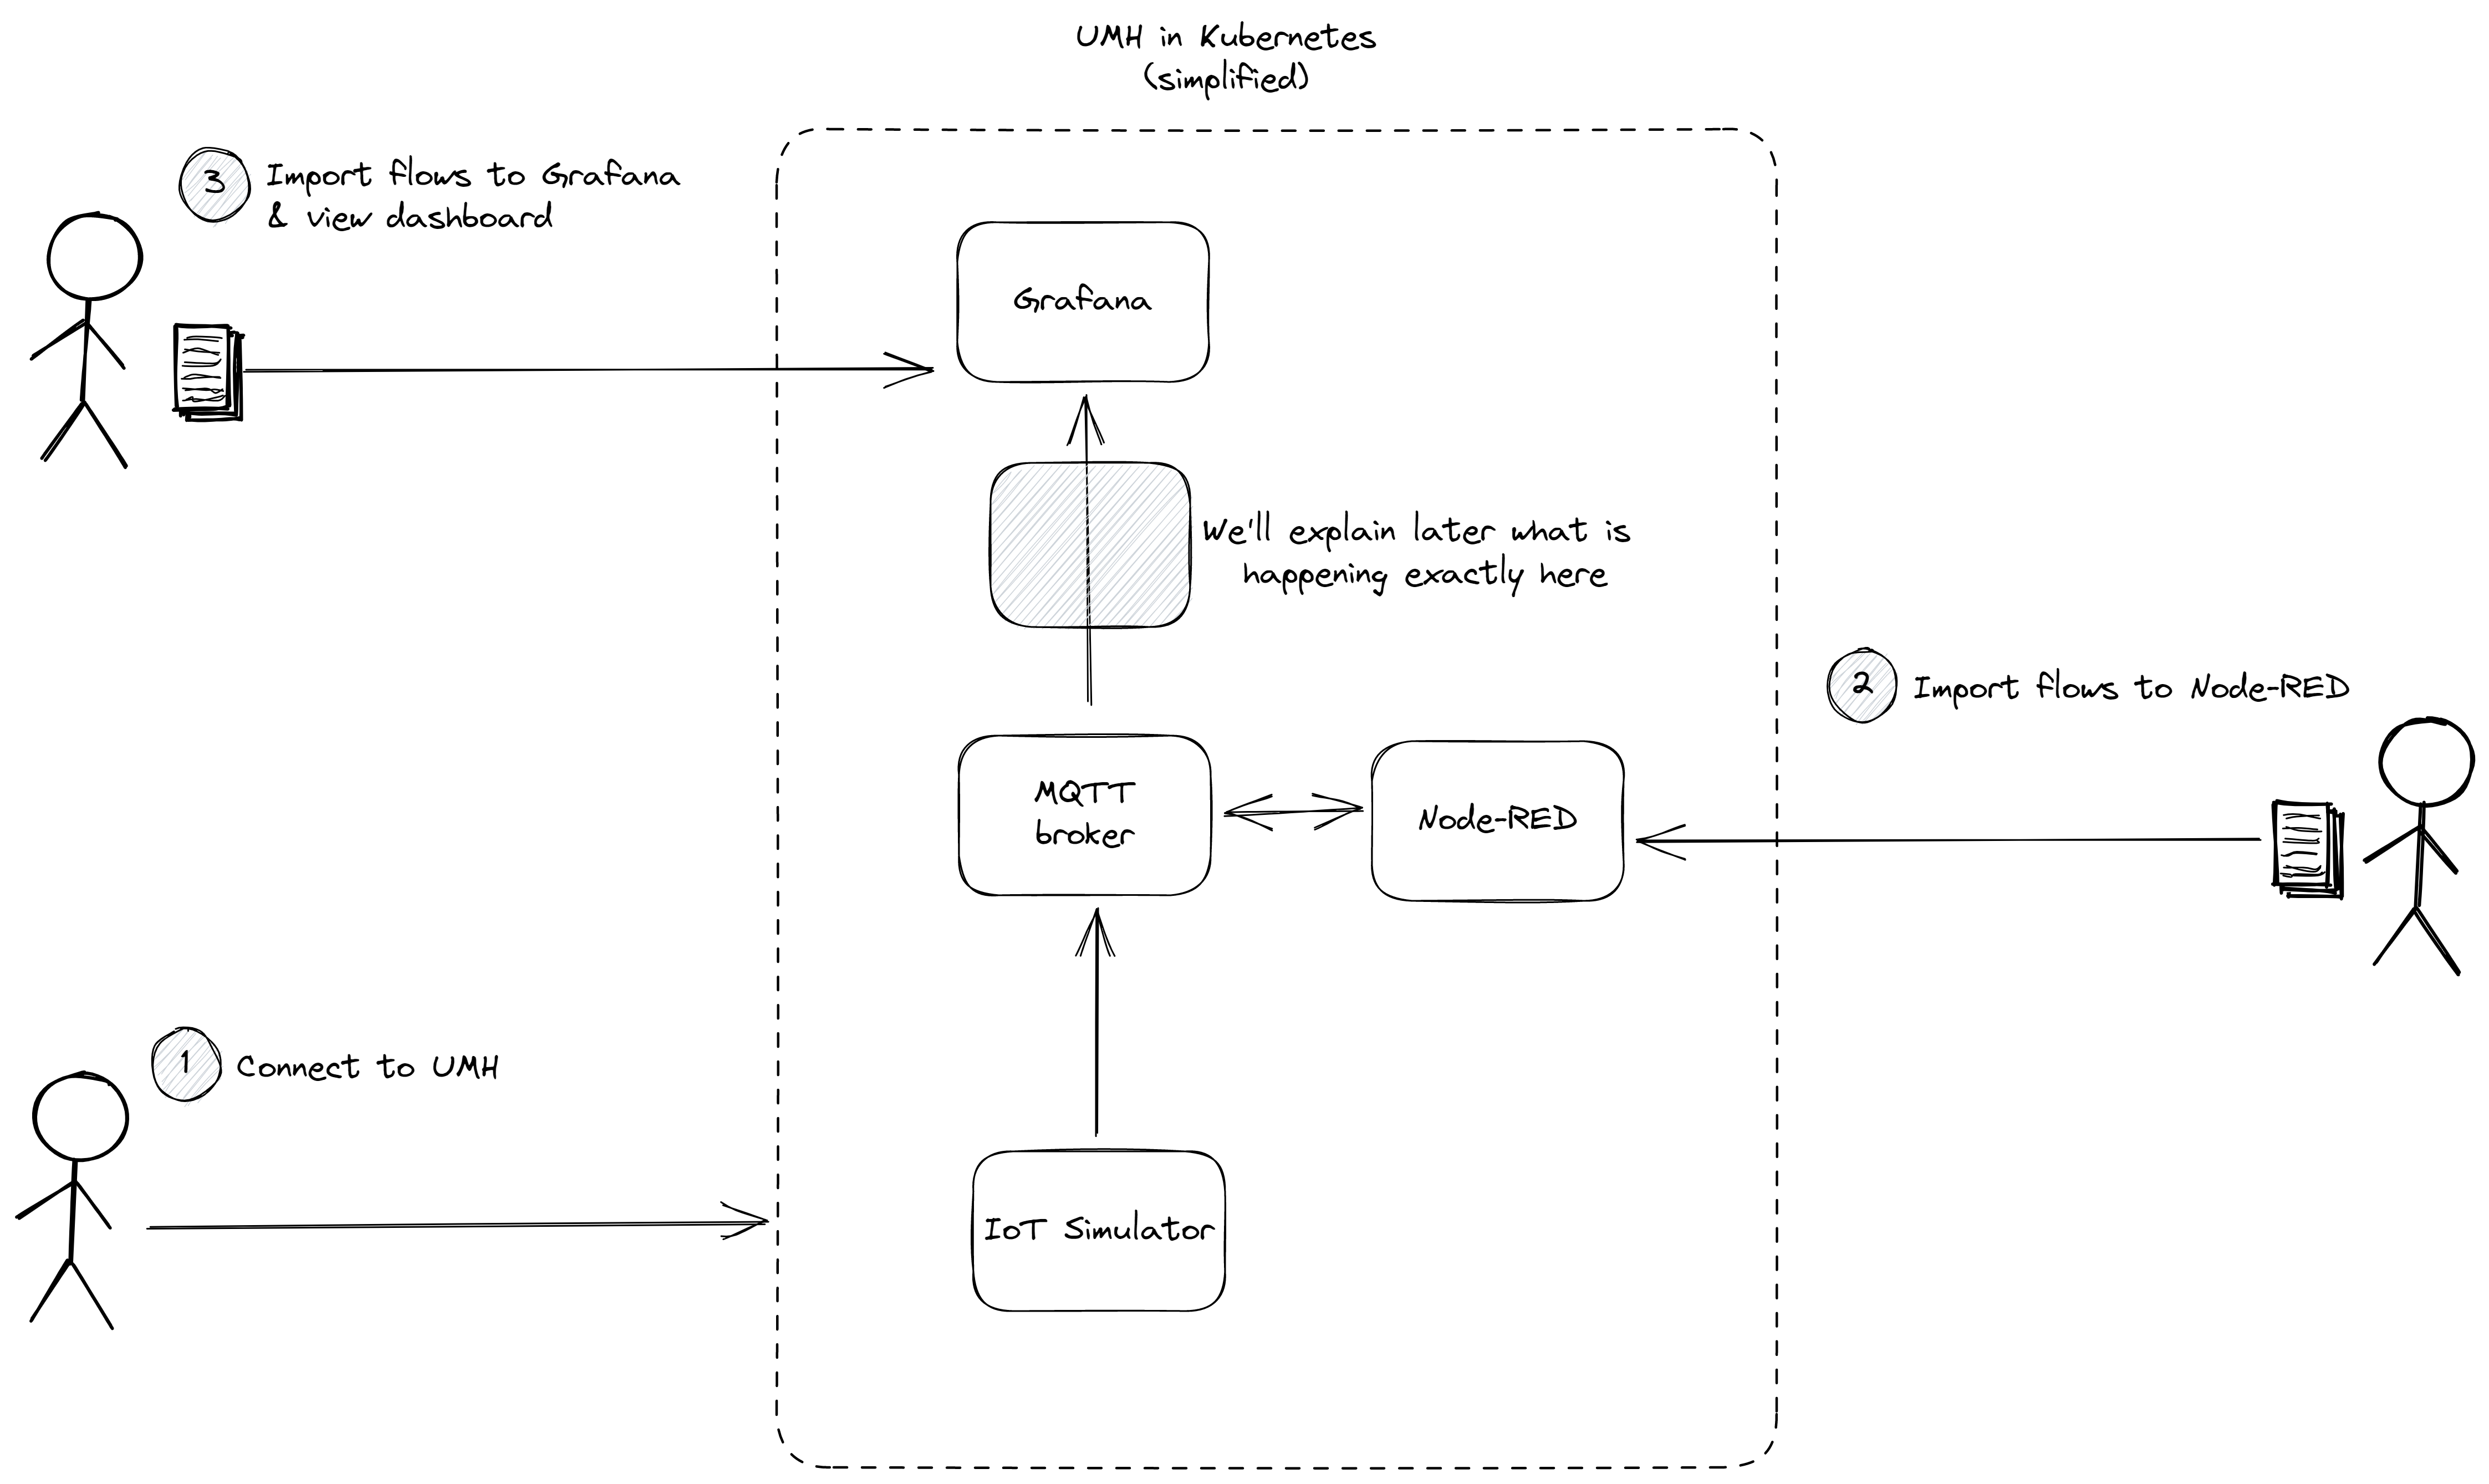
In this chapter, we’ll guide you through connecting to our Kubernetes cluster using UMHLens. Then, we’ll walk you through importing a Node-RED and Grafana flow to help you visualize how data flows through the stack. Check out the image below for a sneak peek
1. Connect to UMH
Download & install UMHLens here.
If you installed the UMH using the management console, you should see a cluster named “k3d-united-manufacturing-hub” under Browse. Click on it to connect.
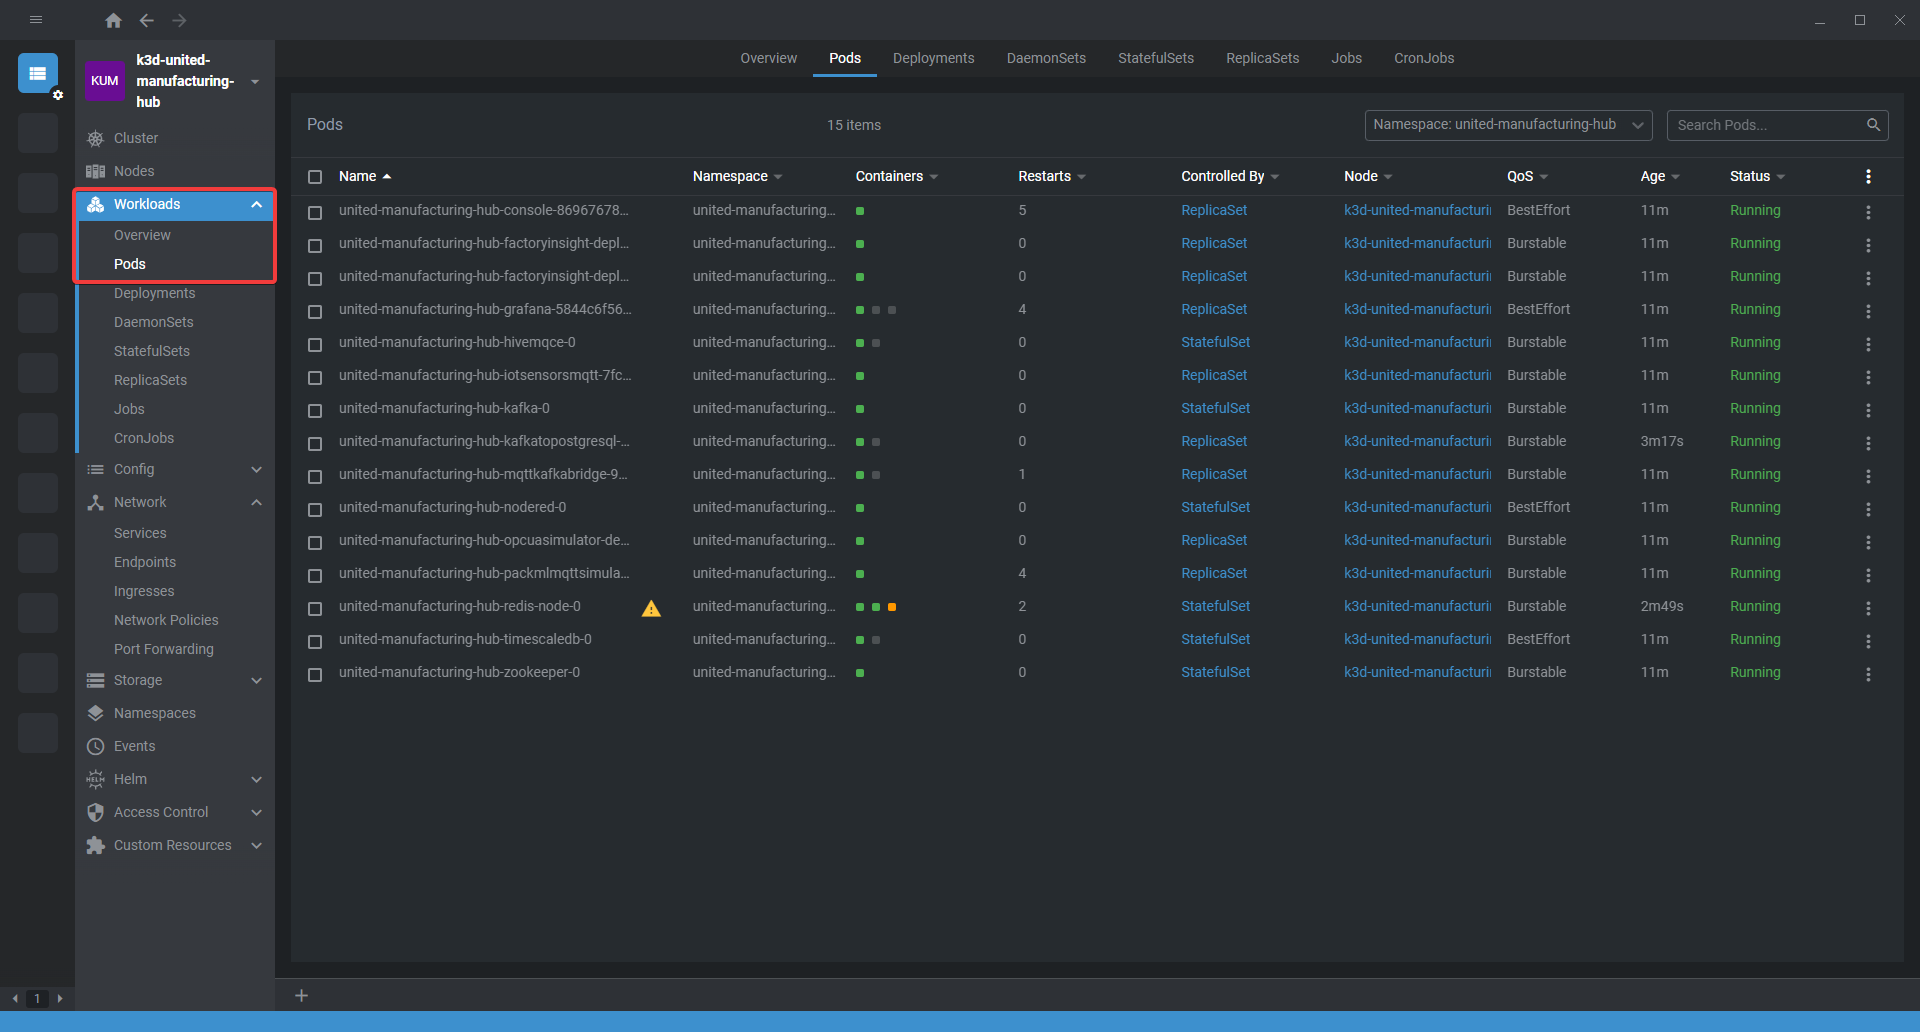
On the right side of UMHLens under workloads -> pods you can check the status of all pods. Depending on your system, it may take a while for all pods to start.
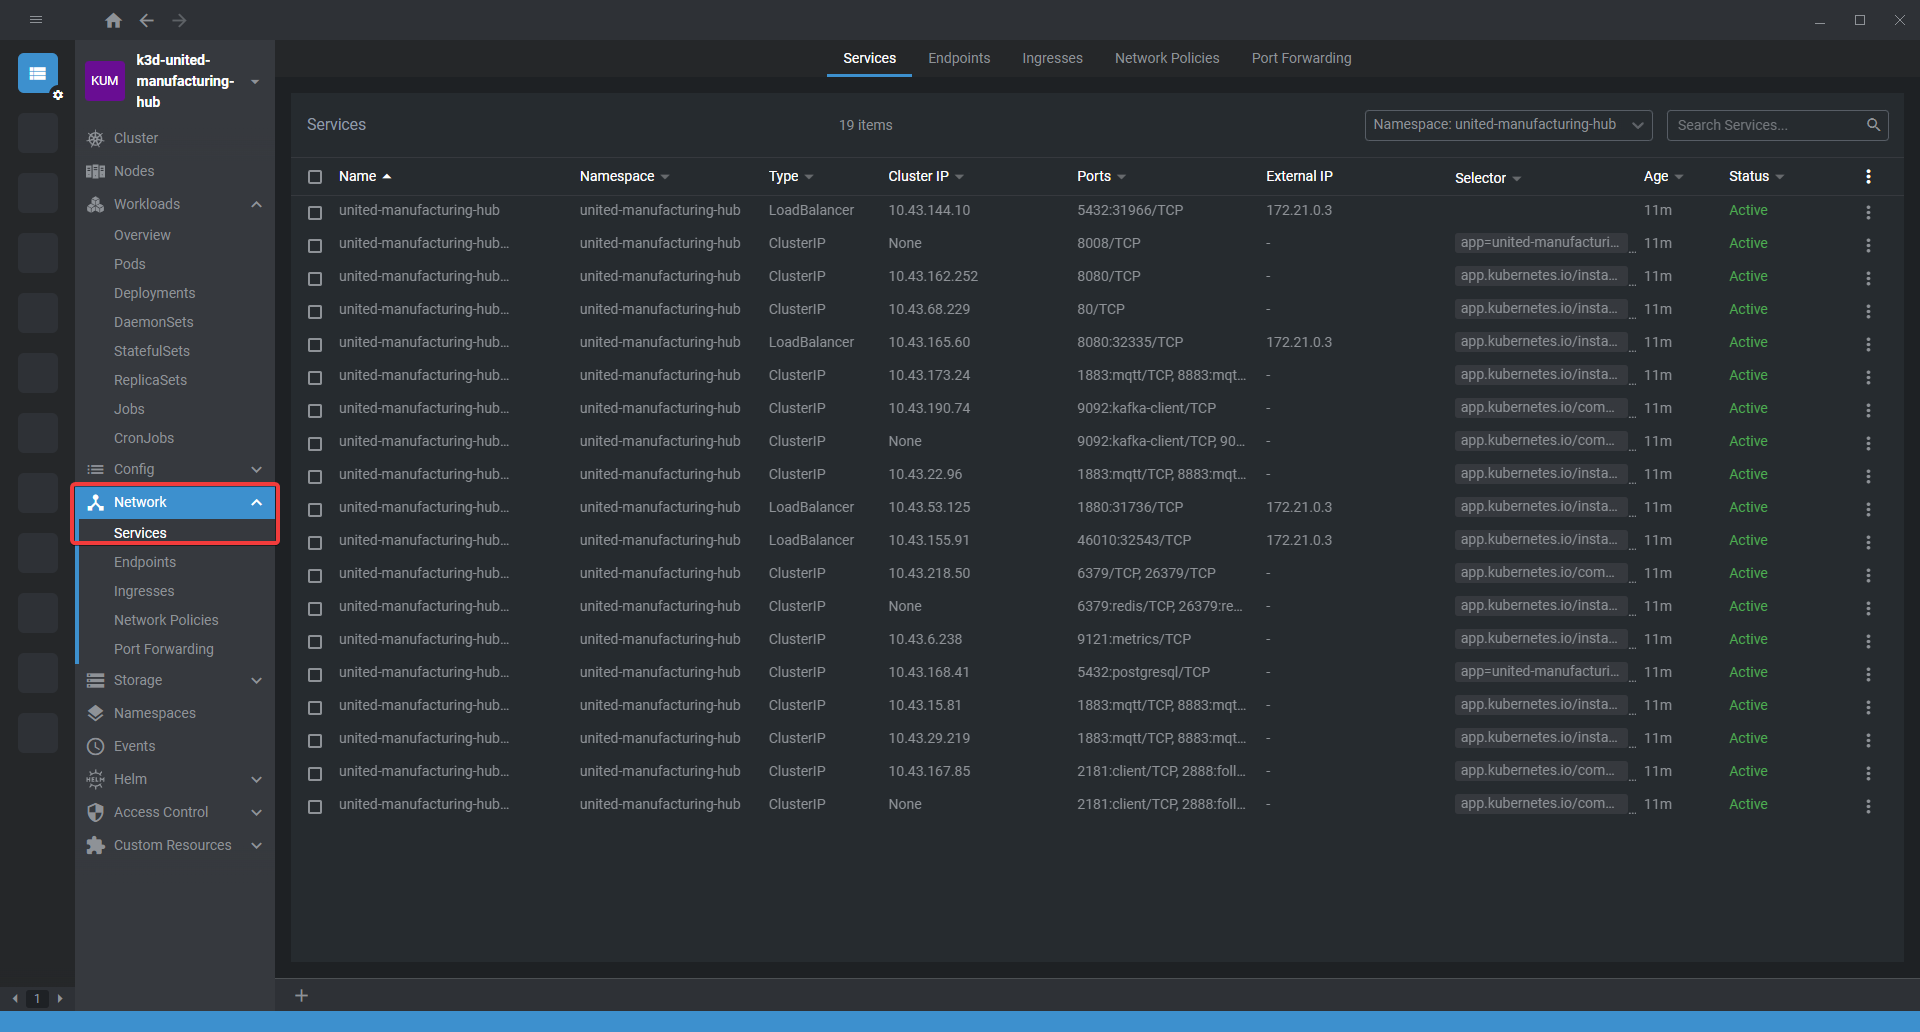
To access the web interfaces of the microservices, e.g. node-red or grafana, navigate to network->services on the left-hand side.
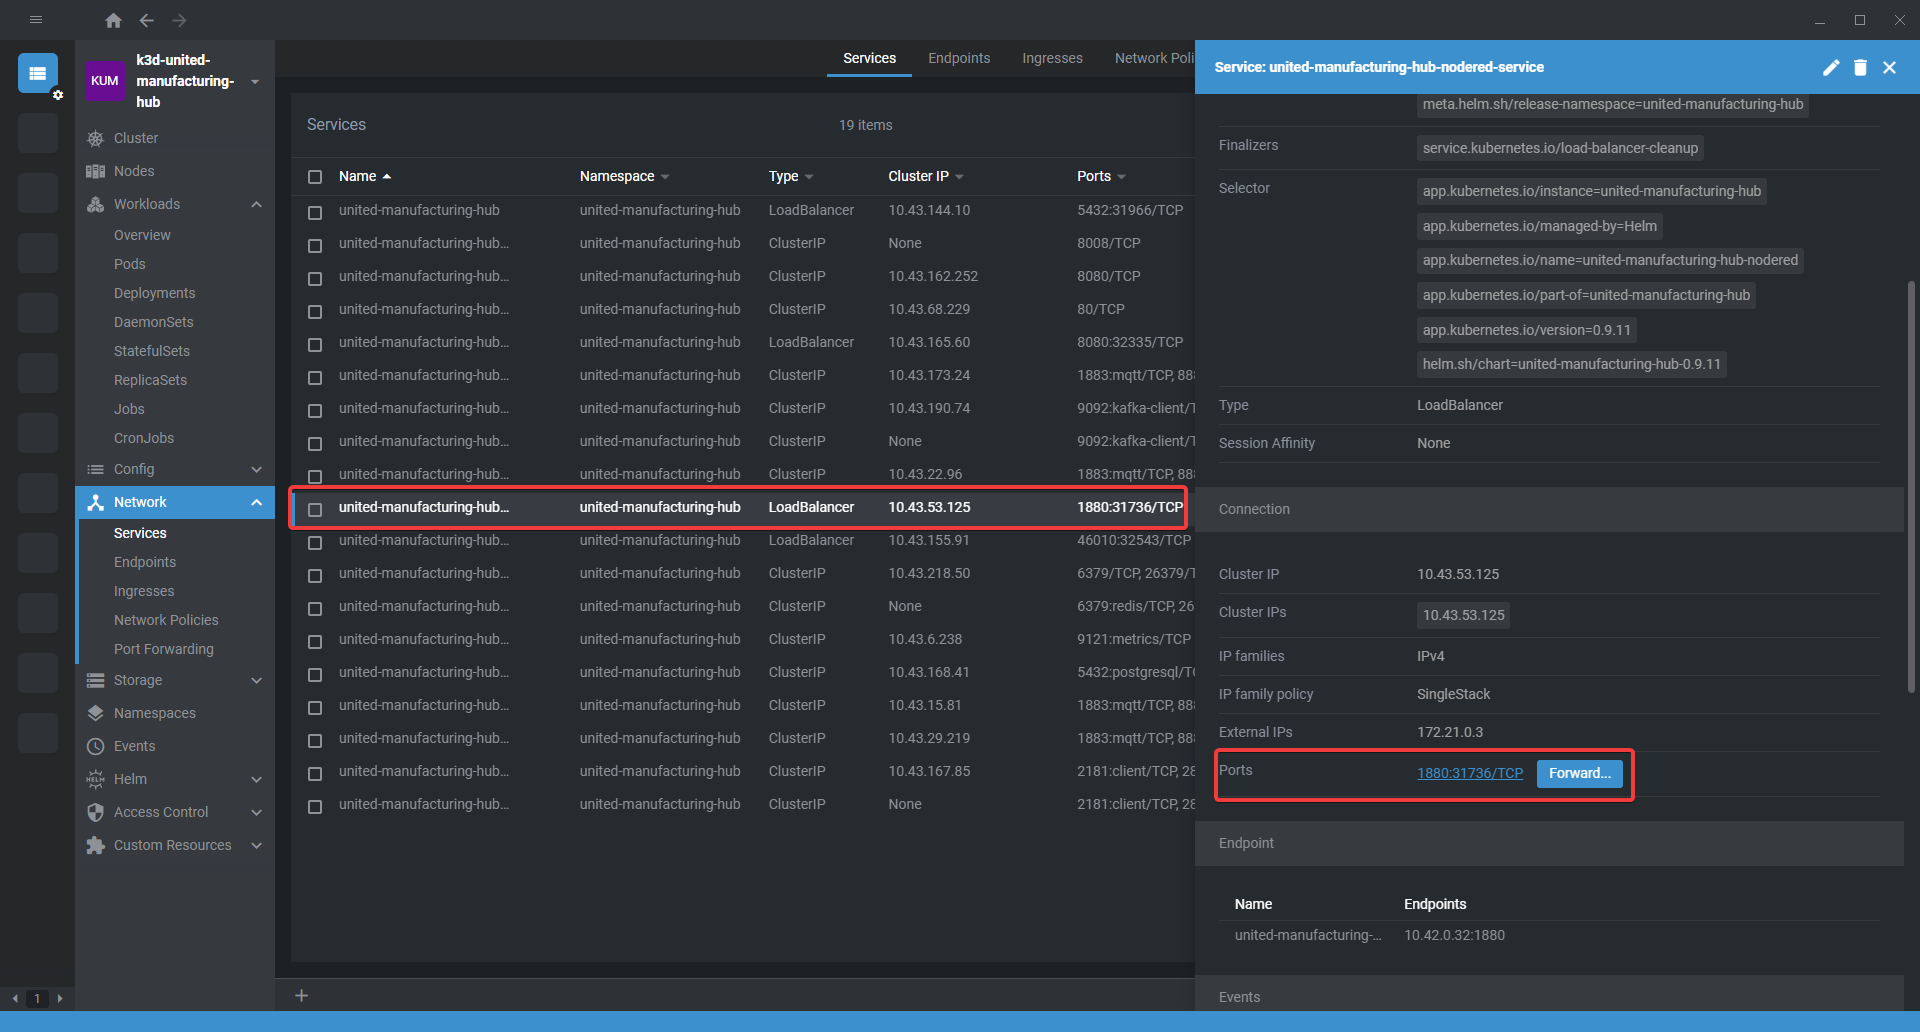
Click on the appropriate service you wish to connect to, scroll down to Connection and forward the port.
2. Import flows to Node-RED
Access the Node-RED Web UI. To do this, click on the service and forward the port as shown above. When the UI opens in the browser, add
noderedto the URL as shown in the figure below to avoid the cannot get error.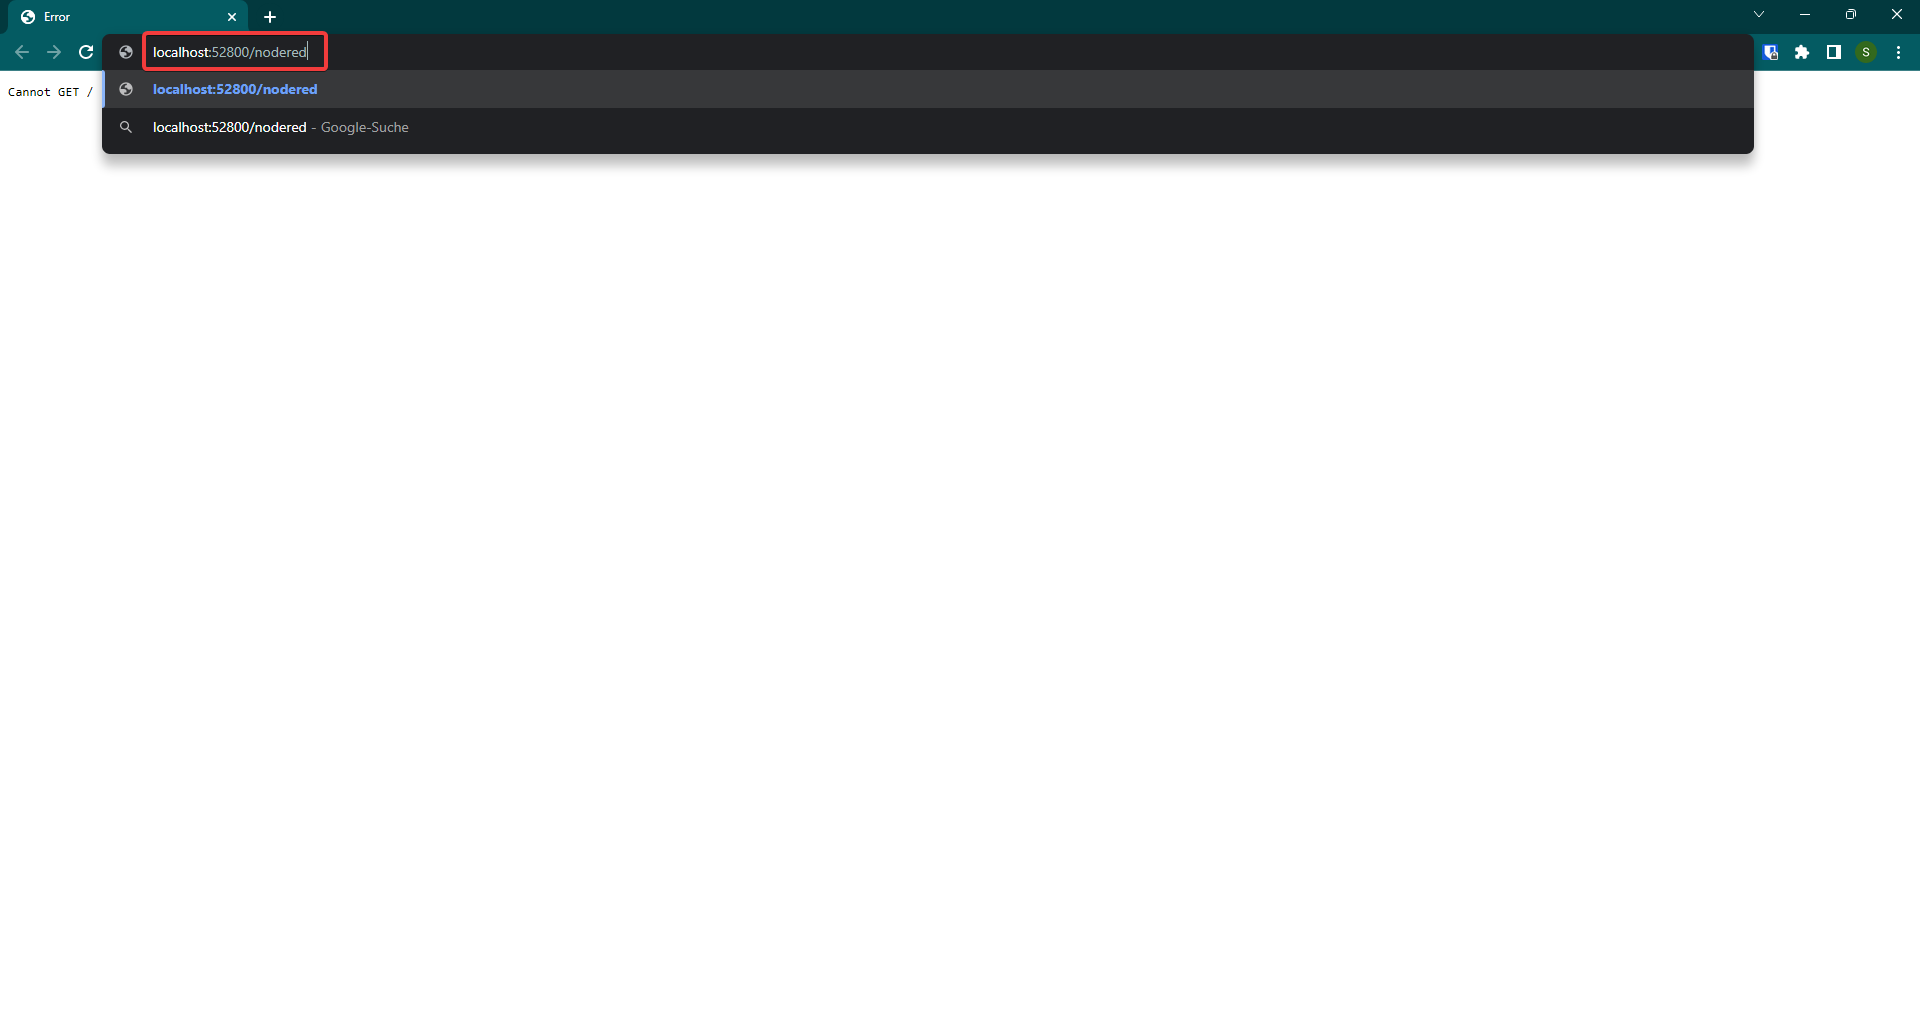
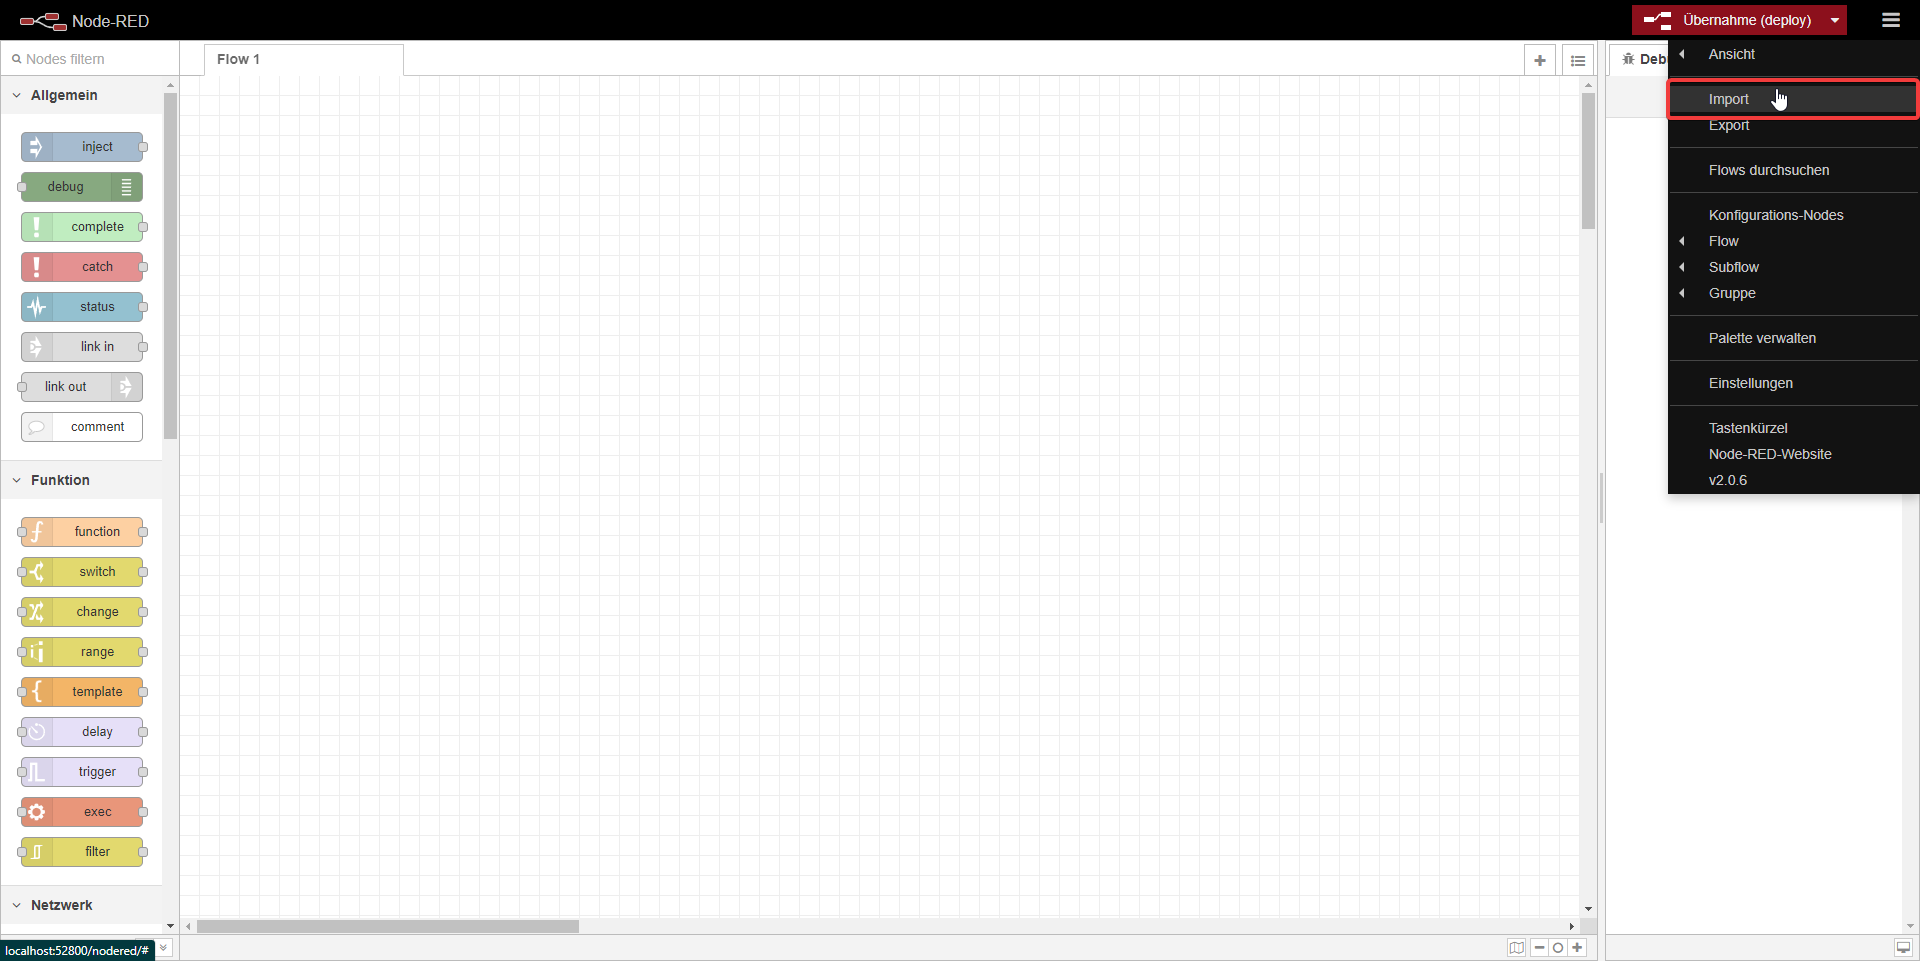
Once you are in the web interface, click on the three lines in the upper right corner and select Import.
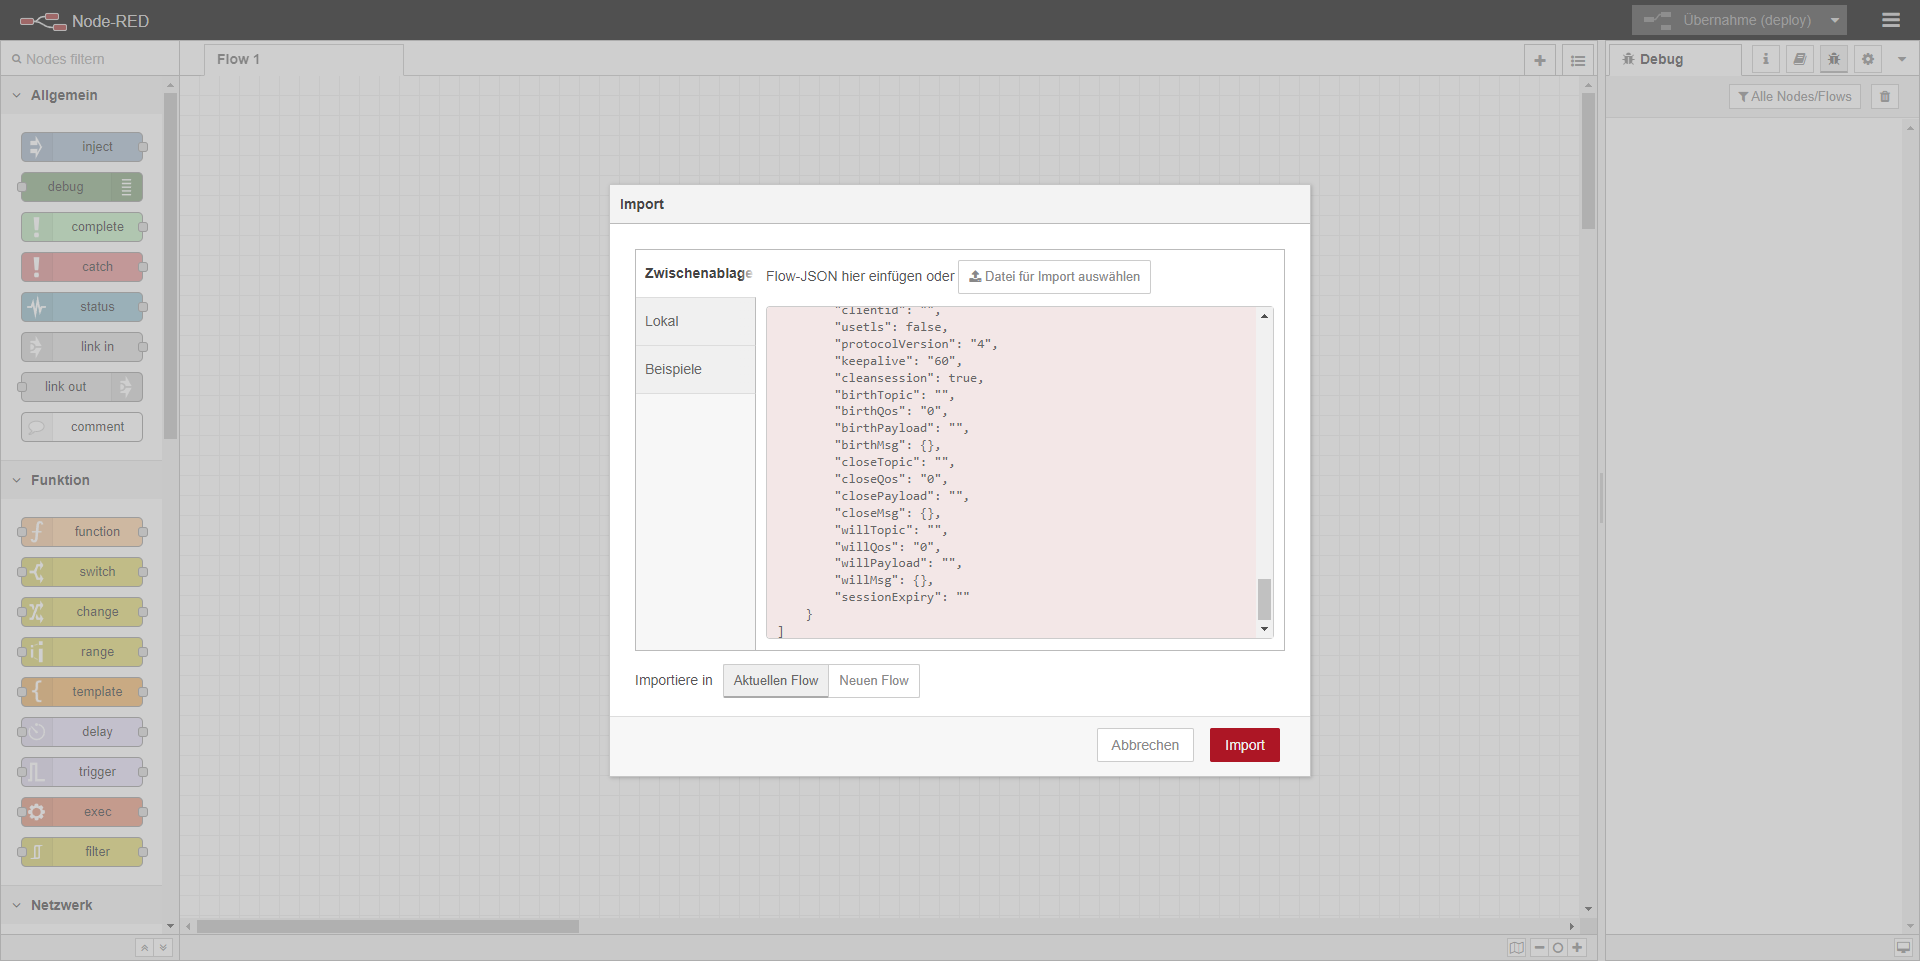
Now copy this json file and paste it into the import field. Then press Import.
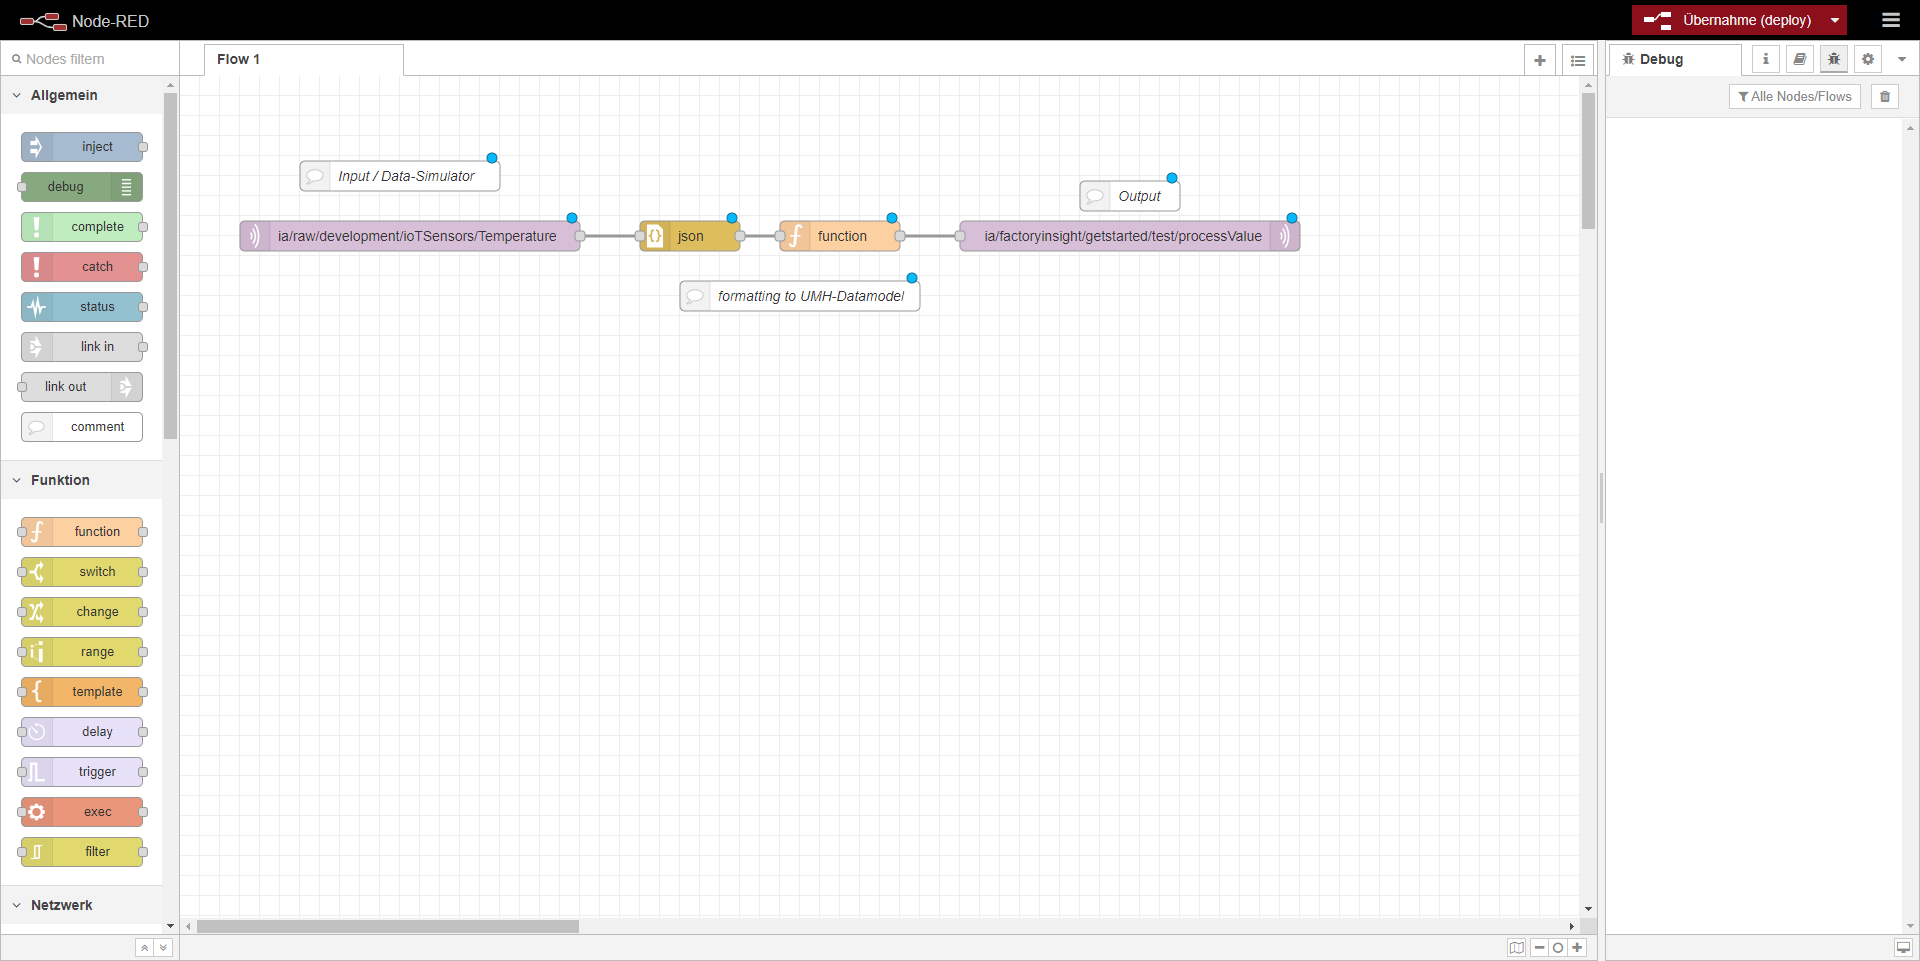
To activate the imported flow, simply click on the Deploy button located at the top right of the screen. If everything is working as expected, you should see green dots above the input and output. Once you’ve confirmed that the data is flowing correctly, you can proceed to display it in Grafana
3. Import flows to Grafana & view dashboard
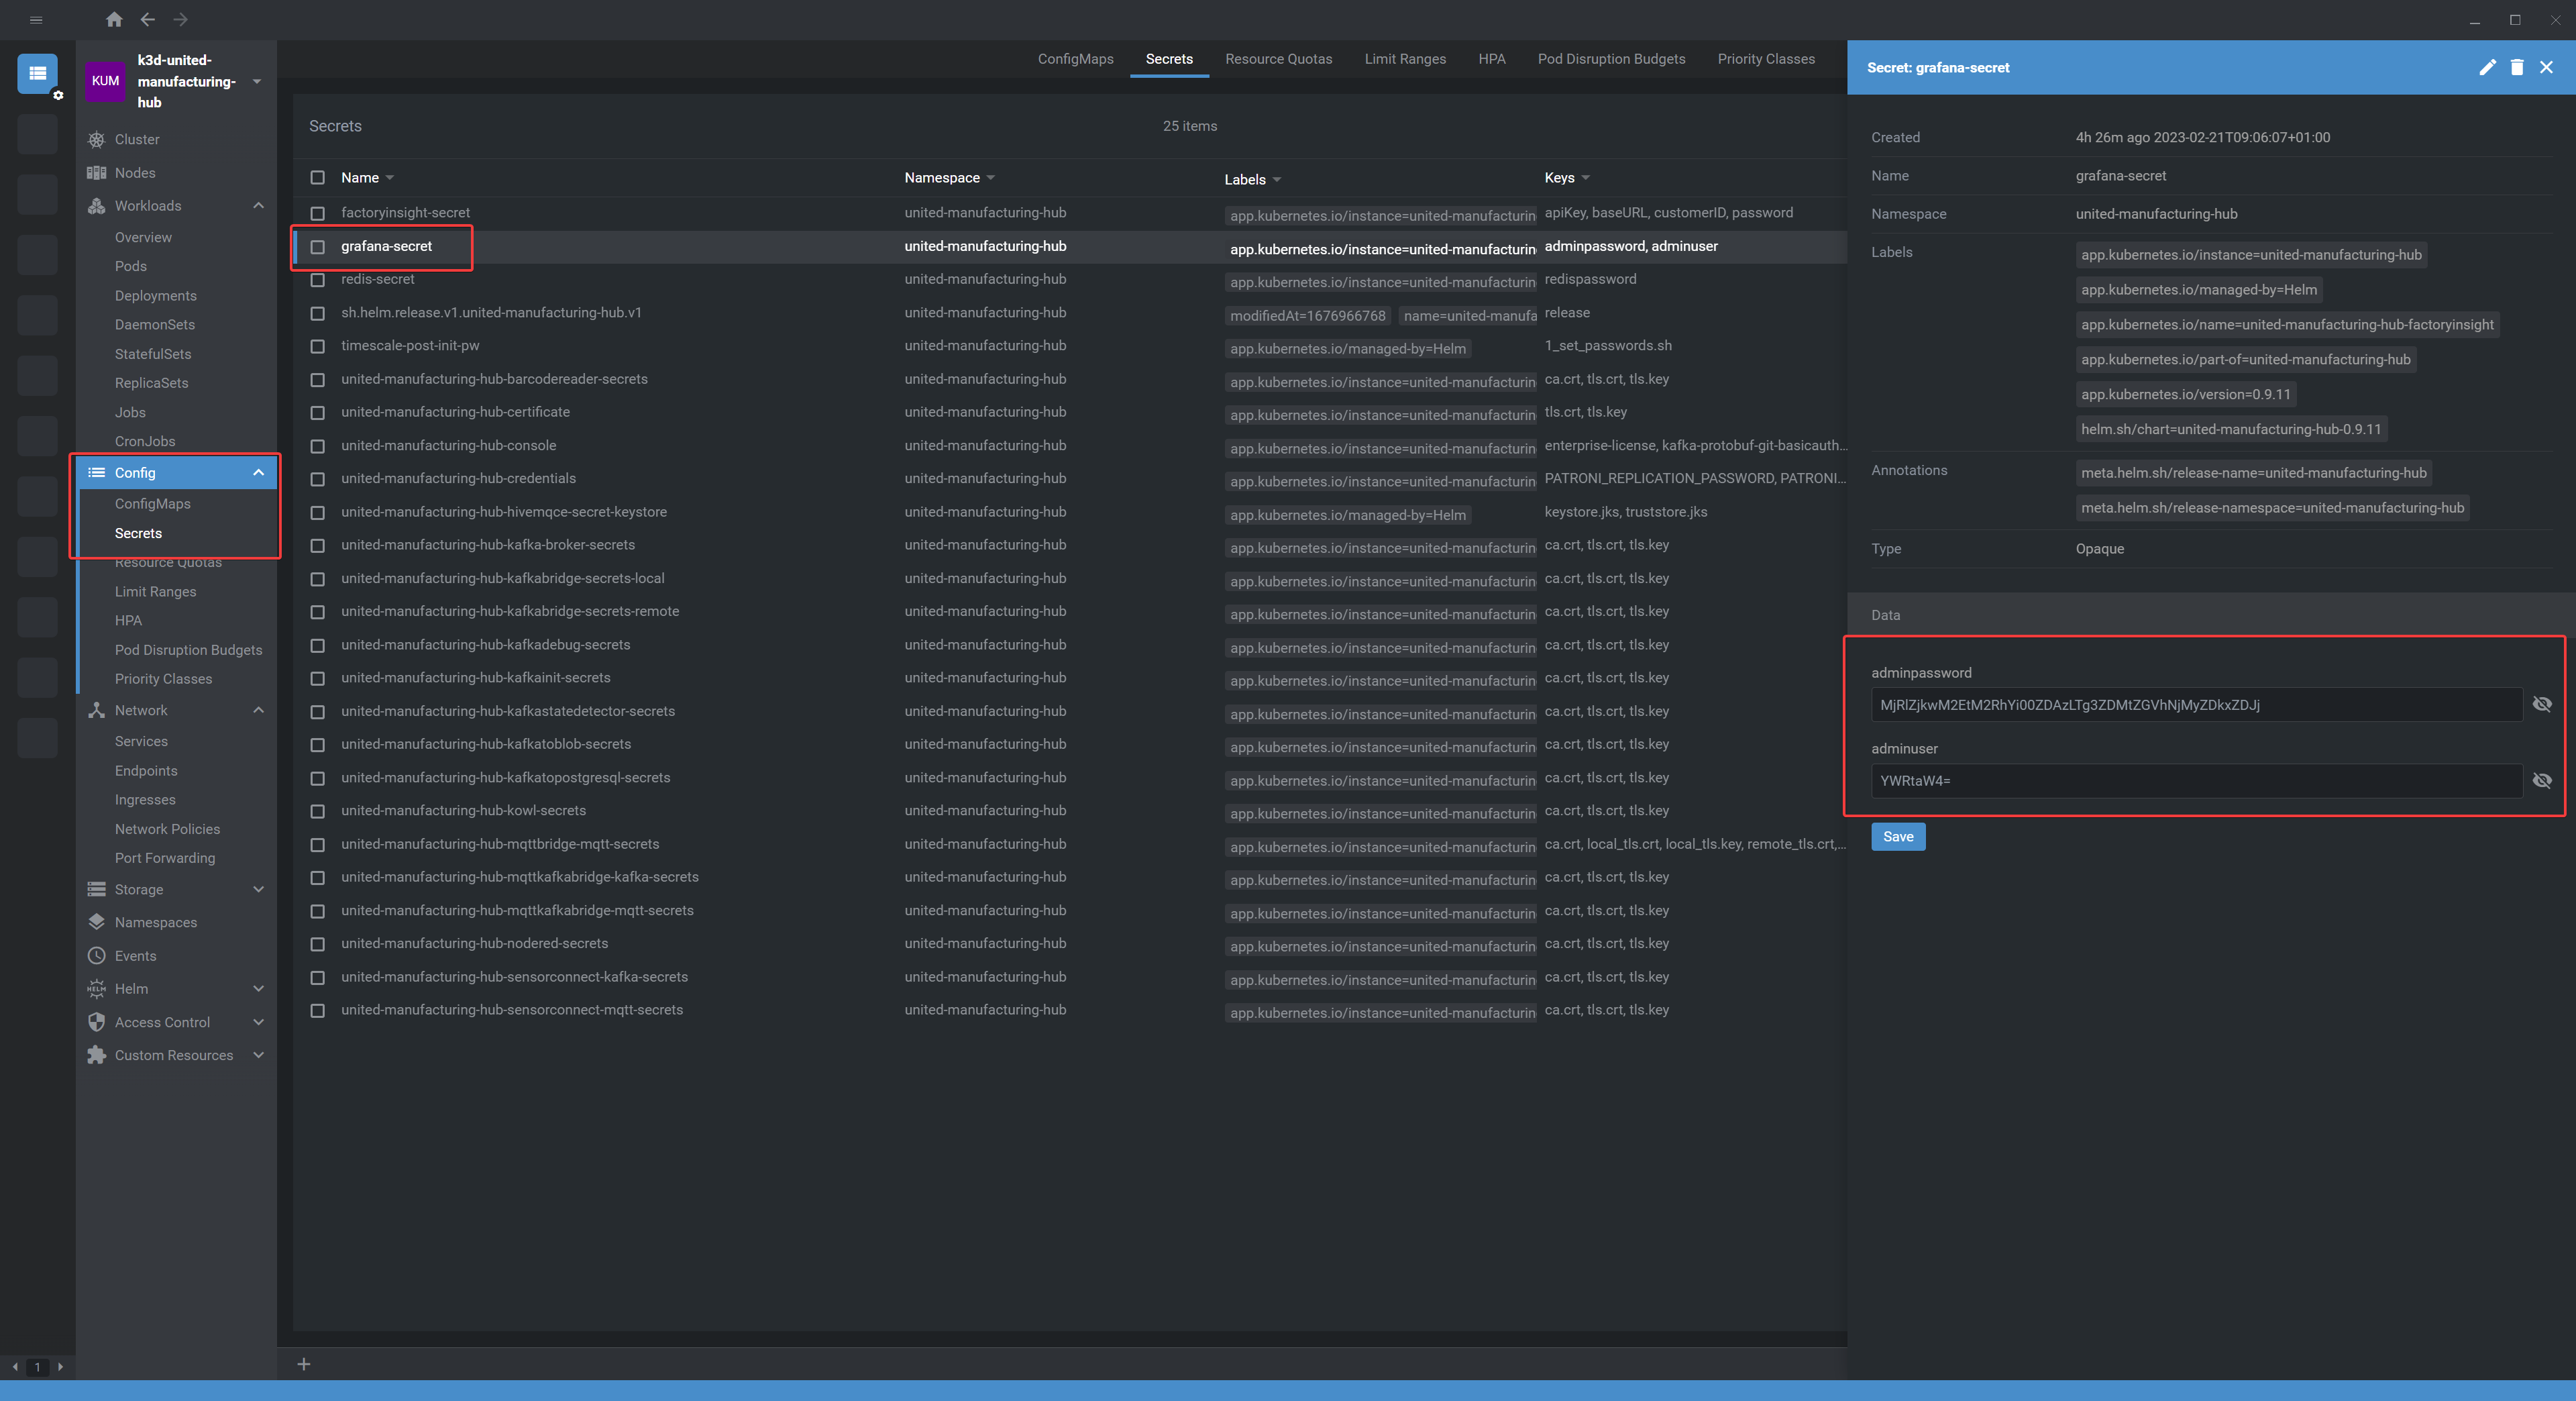
Go into UMHLens and forward the grafana service as you did with node-red. To log in, you need the grafana Secrets, which you can find in UMHLens under Config -> Secrets -> Grafana-Secret. Click on the eye to display the username and password and enter it in grafana.
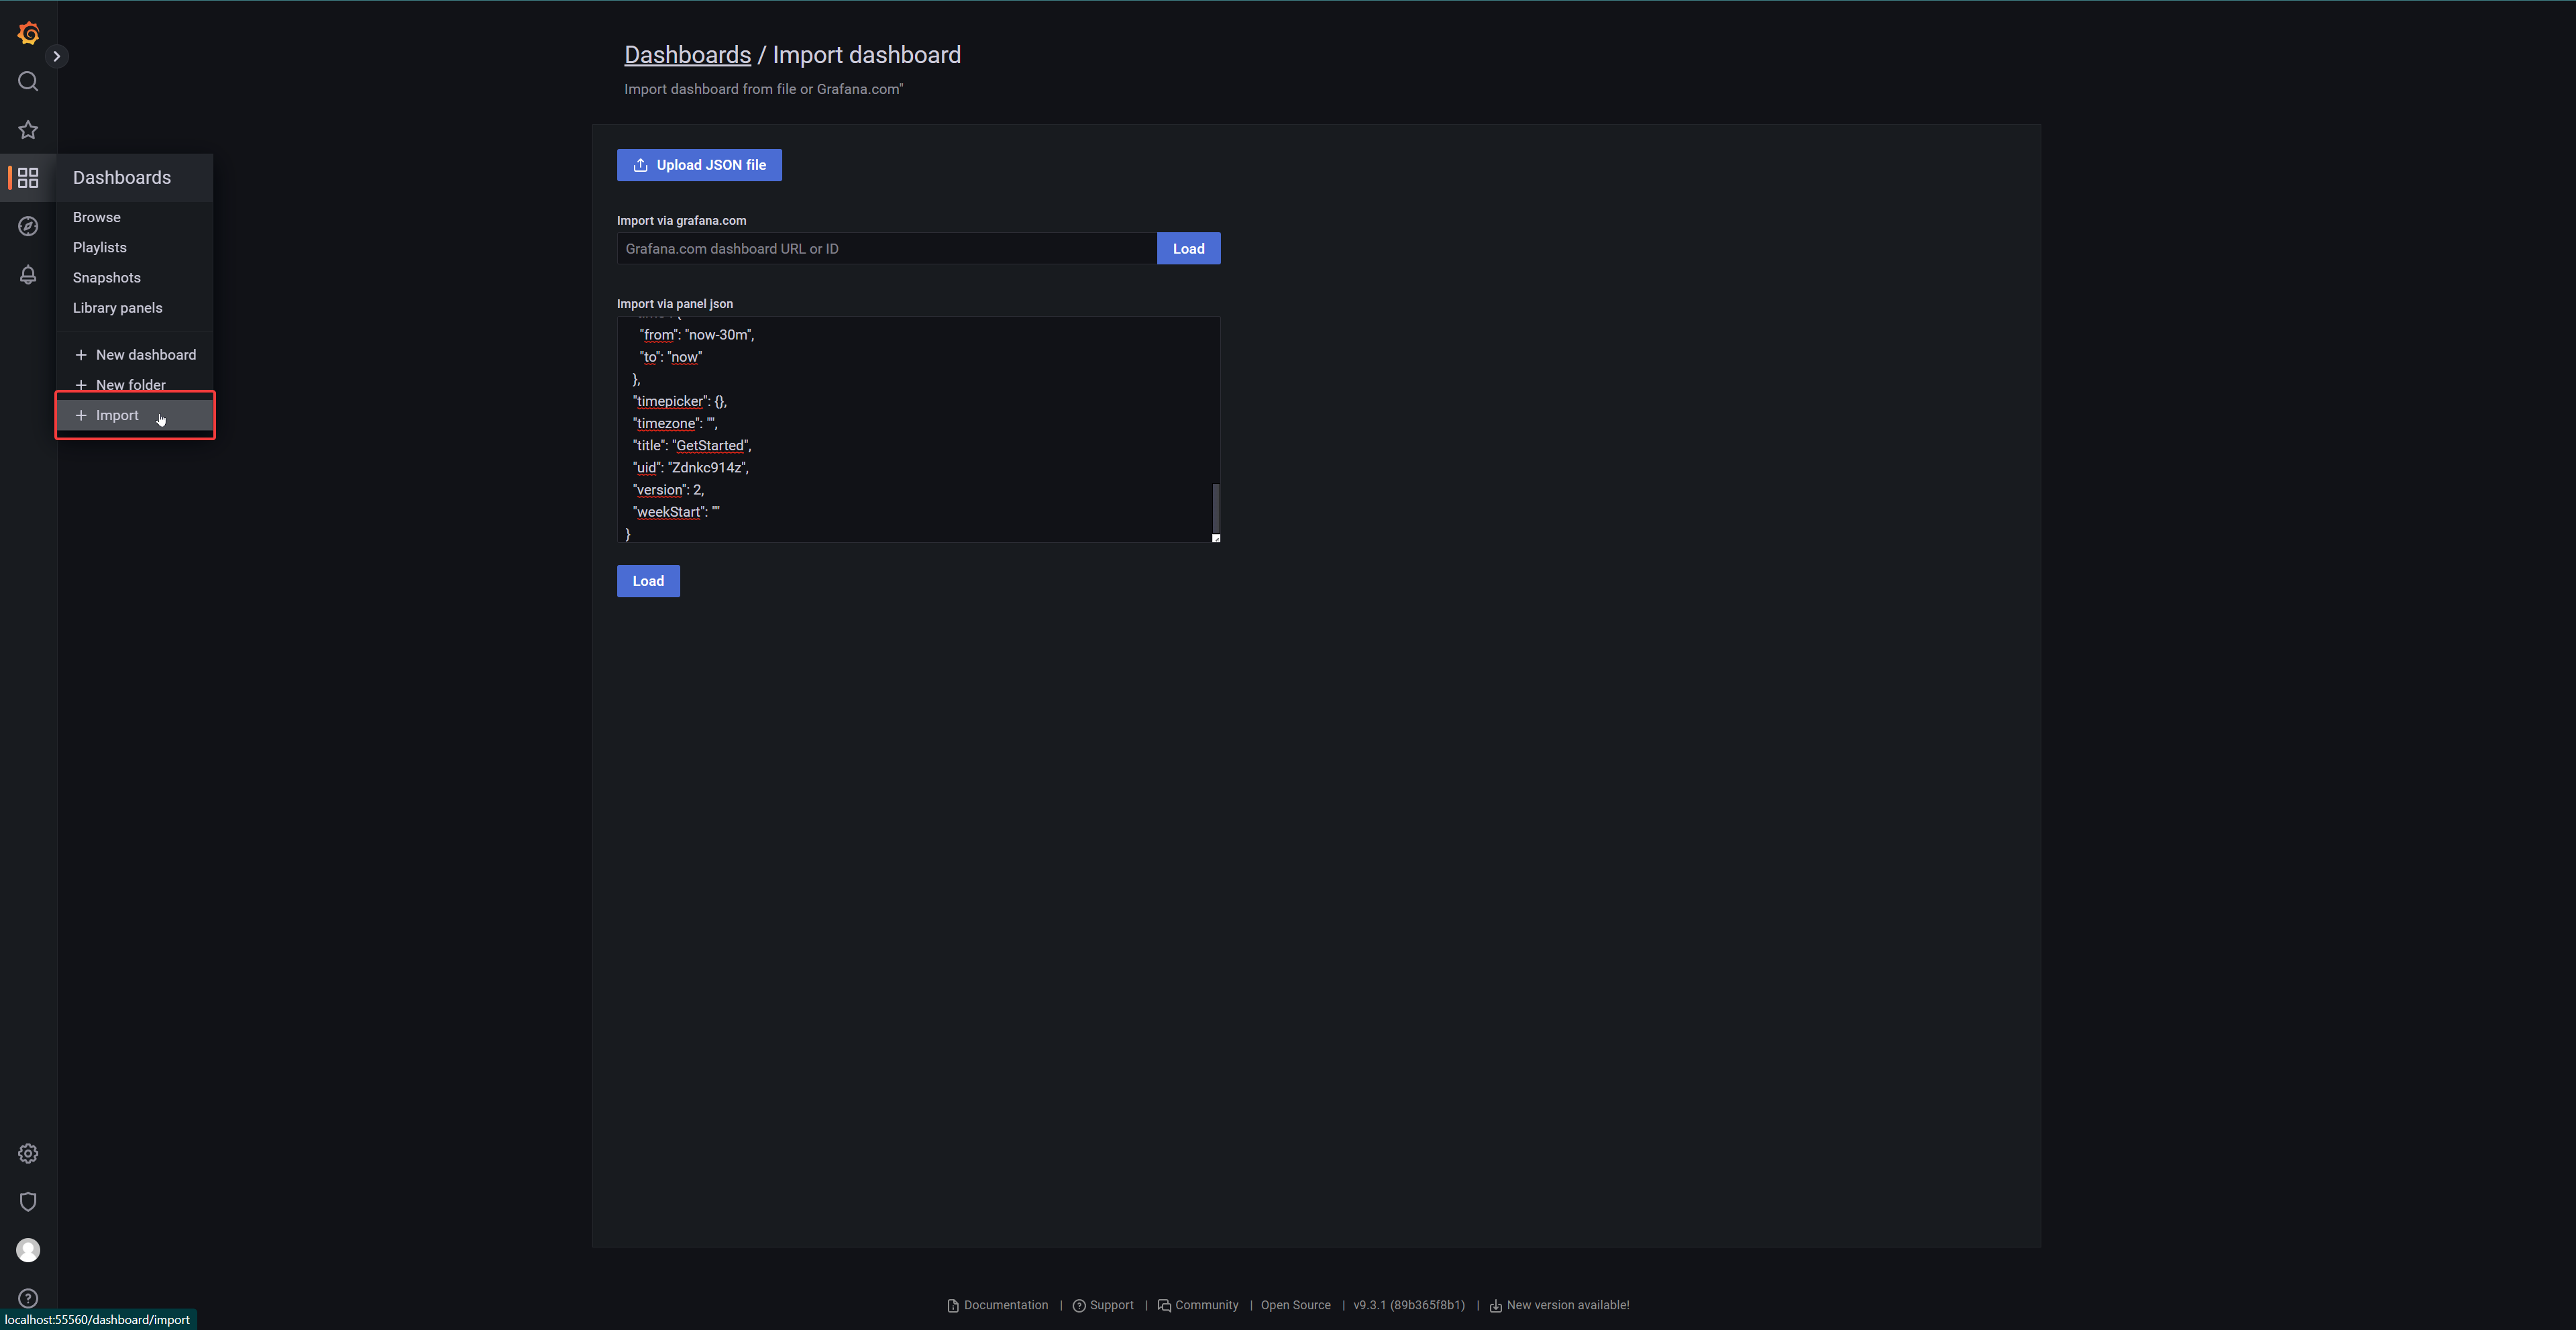
Once you are logged in, click on Dashboards on the left and select Import. Now copy this Grafana json and paste it into Import via panel json. Then click on Load. You will then be redirected to Options where you need to select the umh-v2-datasource. Finally, click on Import.
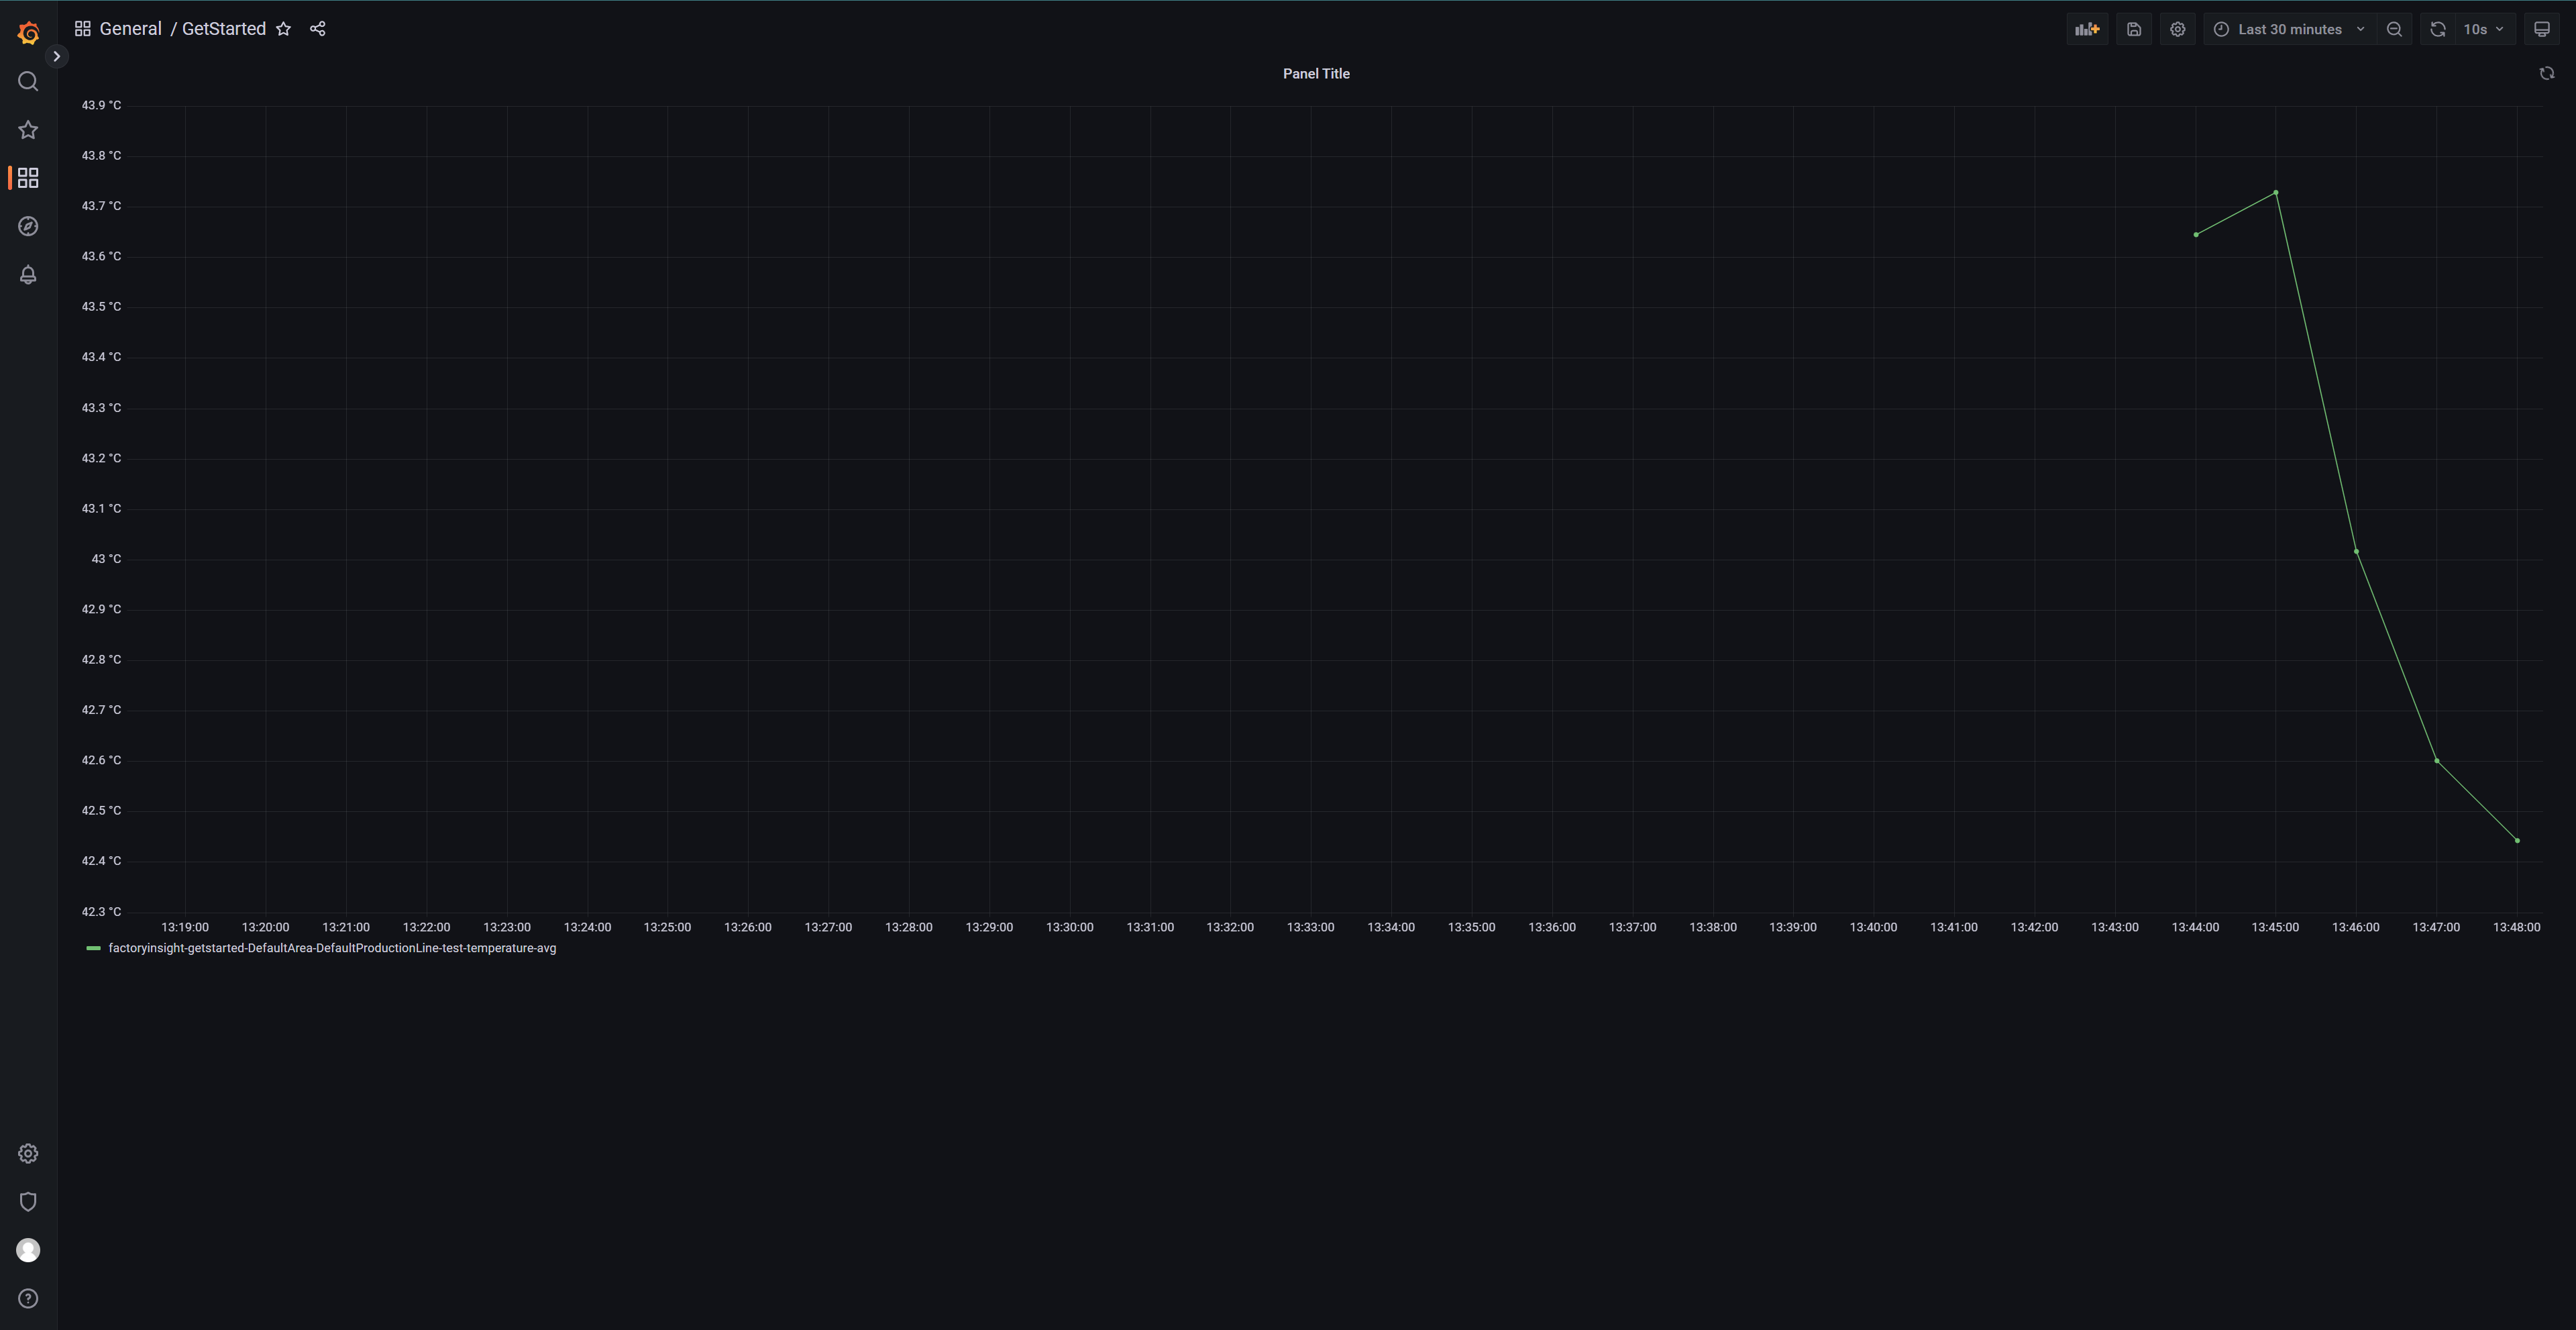
If everything is working properly, you should now see a functional dashboard with a temperature curve.
What’s next?
Next, you can create a node-red flow for yourself and then learn how to create a dashboard in Grafana. Click here to proceed.